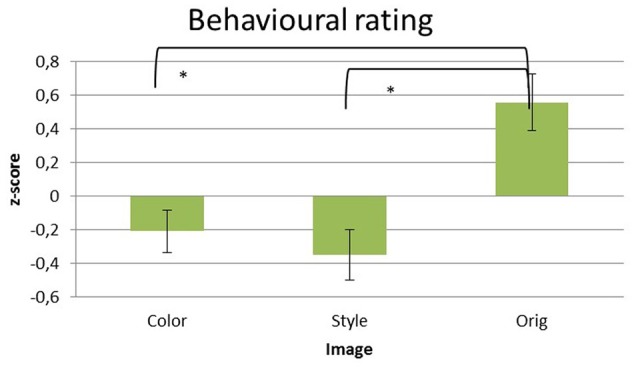
Figure 2.

Z-score transformed average values of liking given explicitly by the subjects after the observation of each picture in the three datasets of images analyzed: Color, Style, and Orig. Error bars indicate standard deviations. Statistically significant pair-wise comparisons are highlighted with asterisks at p < 0.05.
