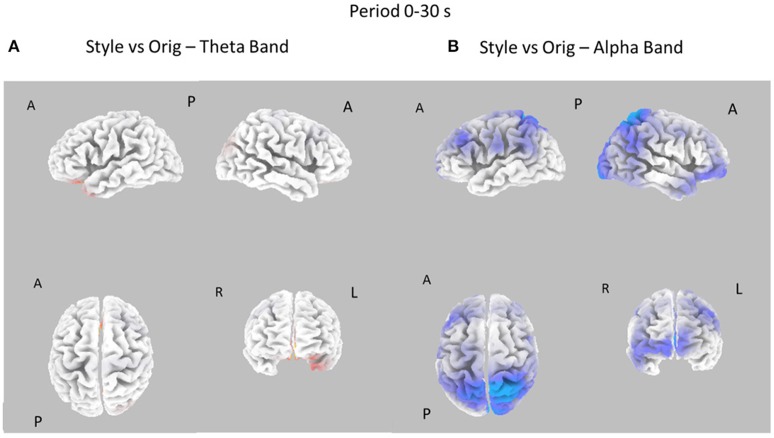
Figure 5.
Eight cortical t-test maps of PSD values for the Style vs. Orig comparison in the Theta (A) and Alpha (B) band during the entire 30 s of observation of the pictures. Same conventions as in Figure 3. Blue color is used when the activity is statistically higher in the Orig than in the Style condition (t-values at p < 0.05). Red color is used when the activity is statistically higher in the Style than in the Orig condition (t-values at p < 0.05).

