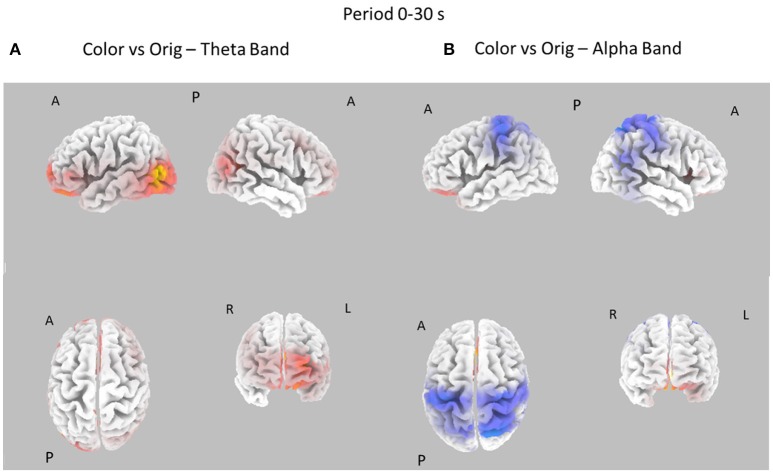
Figure 6.
Eight cortical t-test maps of PSD values for the Color vs. Orig comparison in the Theta (A) and Alpha (B) band during the entire 30 s of observation of the pictures. Same conventions as in Figure 3. Blue color is used when the activity is statistically higher in the Orig than in the Color condition while red color is used when the activity is statistically higher in the Color than in the Orig condition (t-values at p < 0.05, corrected for multiple comparisons).

