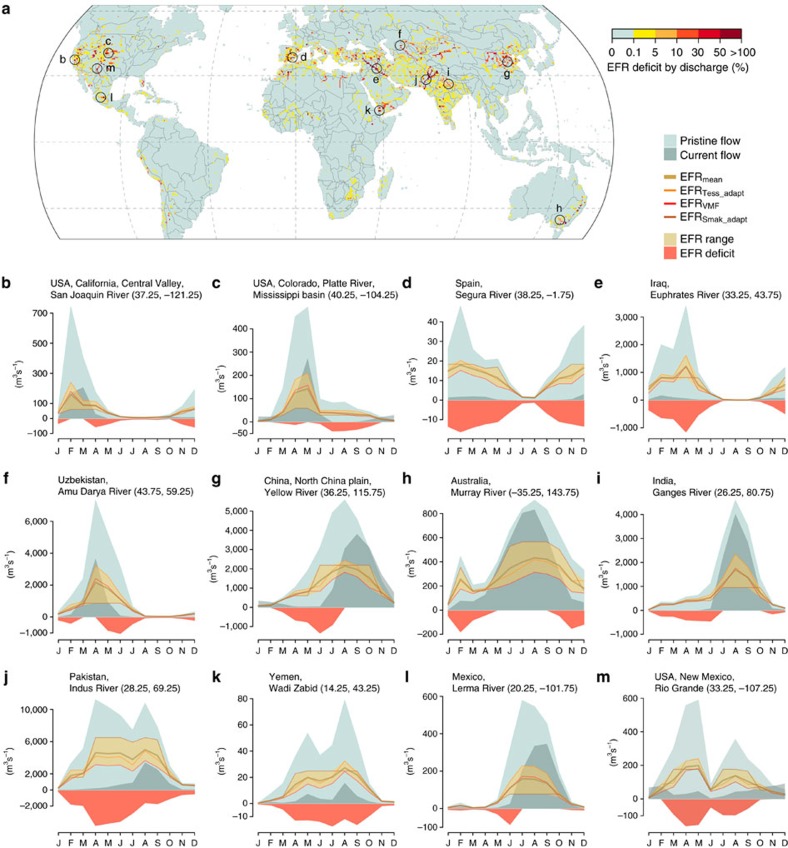
Figure 1. Discharge and environmental flows of selected river stretches.
The map (a) illustrates the mean annual EFR deficit (EFR minus current discharge, if >0) relative to mean annual discharge. Hydrographs (b–m, locations indicated on the map) highlight seasonal flow alterations (pristine versus current discharge) together with EFR estimates (mean, Tessmannadapted, VMF, Smakhtinadapted, Methods section) and, if unmet, the mean EFR deficit. All estimates are in m3 s−1 and for the time period 1980–2009.

