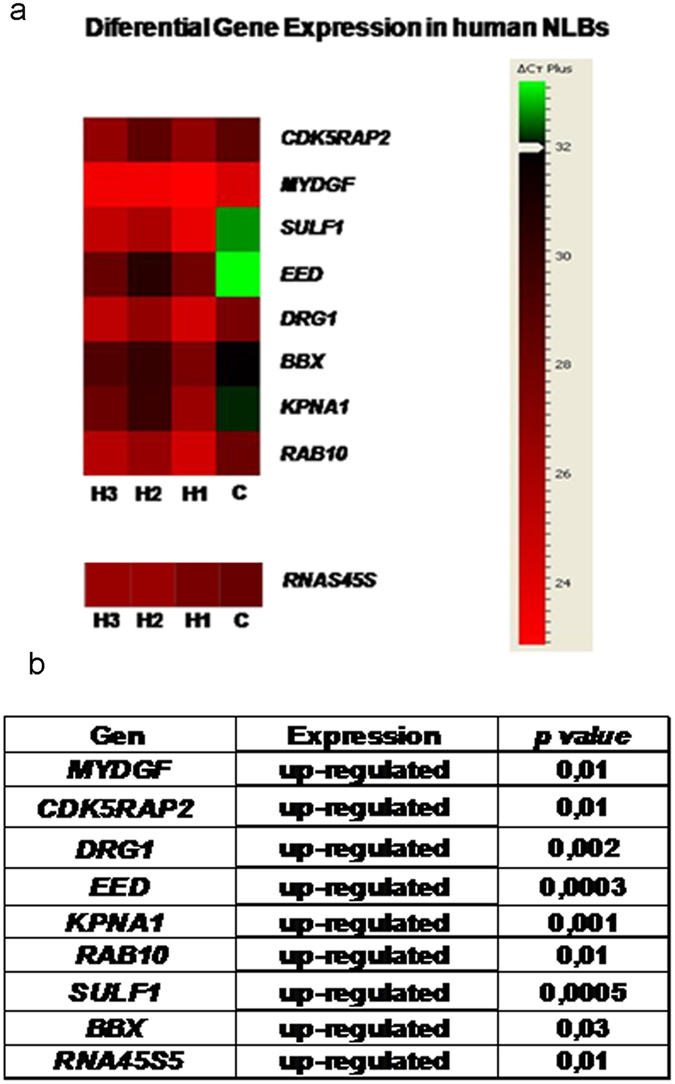
Figure 3.

Differential gene expression in HSCR-NLBs versus Control-NLBs. (a) The Heat map was generated using DataAssist v3.0 software (Life Technologies) and it represents the messenger RNA expression levels of 9 genes expressed in colon tissue from HSCR patients and controls. Genes were hierarchically clustered by Pearson correlation coefficient using average linkage. The color scale, representing ΔCt, is shown on the right side. Green indicates genes with relatively decreased expression in HSCR, whereas red indicates genes with relatively increased expression in HSCR compared with the controls. Ct, cycle threshold; Hirschsprung patiens (H); Control (C). (b) Table showing the variations in the gene expression levels in the NLBs from HSCR patients compared with Controls.
