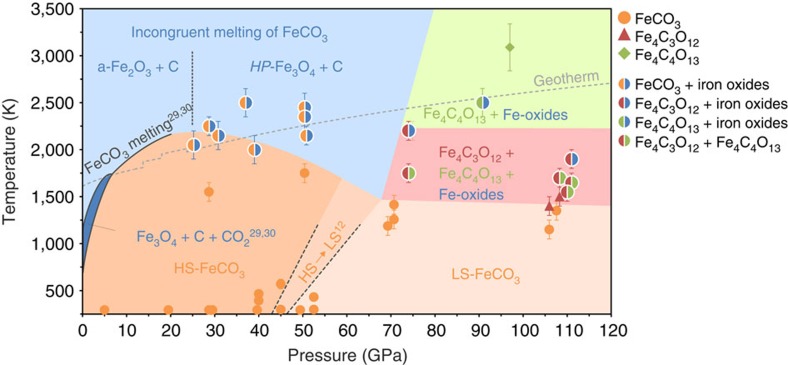
Figure 1. Stability diagram of FeCO3 at high P-T.
Symbols and phase regions identified in experiments: magnesite-structured FeCO3 (orange dots), oxide(s) and recrystallized FeCO3 (orange-blue dots), tetrairon(III) orthocarbonate Fe4C3O12 (red triangles), diiron(II) diiron(III) tetracarbonate Fe4C4O13+Fe4C3O12 (red-green dots), Fe4C4O12+oxides (red-blue dots), Fe4C4O13+oxides (green-blue dots), FeCO3 decomposition to Fe3O4+C+CO2 (refs 29, 30; dark blue area), high- and low- spin FeCO3 (dark and light orange area, respectively), incongruent melting of FeCO3 (light blue area), and formation of HP-carbonates Fe4C3O12 and Fe4C4O13 (red and green areas). The grey dashed curve is the expected mantle geotherm59. The black solid lines are from refs 29, 30. Black dashed lines indicate the region delimiting the spin transition in magnesio-siderite at HPHT from Liu et al.13. The vertical dashed black line separates the regions in which the formation of α-Fe2O3 and HP-Fe3O4 was observed upon incongruent melting of FeCO3.

