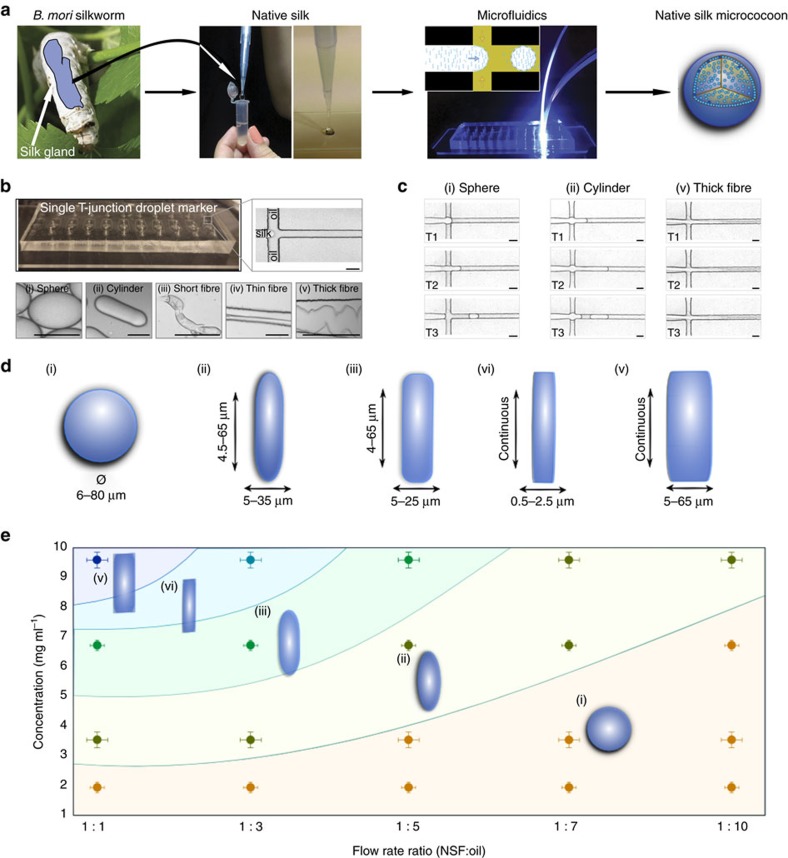
Figure 1. Micrococoon synthesis.
(a) Schematic representation of the microfluidic processing of NSF into micrococoons. (b) Optical microscopy images of the NSF micrococoons formed at a single T-junction in the microfluidic device. Micrographs of a variety of NSF micrococoon shapes are shown in the lower panels: (i) sphere, (ii) cylinder, (iii) short fibre, (iv) thin fibre, (v) thick fibre. Scale bar, 20 μm. (c) Micrographs of NSF micrococoon formation acquired at three different time points T1, T2 and T3: (i) sphere; T1=0 ms, T2=10 ms, T3=13 ms, (ii) cylinder; T1=0 ms, T2=13 ms and T3=34 ms and (v) thick fibre; T1=0 ms, T2=59 ms, T3=68 ms. Scale bar, 20 μm. (d) S schematic representations showing the characteristic dimensions of the NSF micrococoons generated in this study. (e) Different micrococoon shapes generated as a function of the protein concentration and of the ratio of the flow rates of the aqueous to oil phases.

