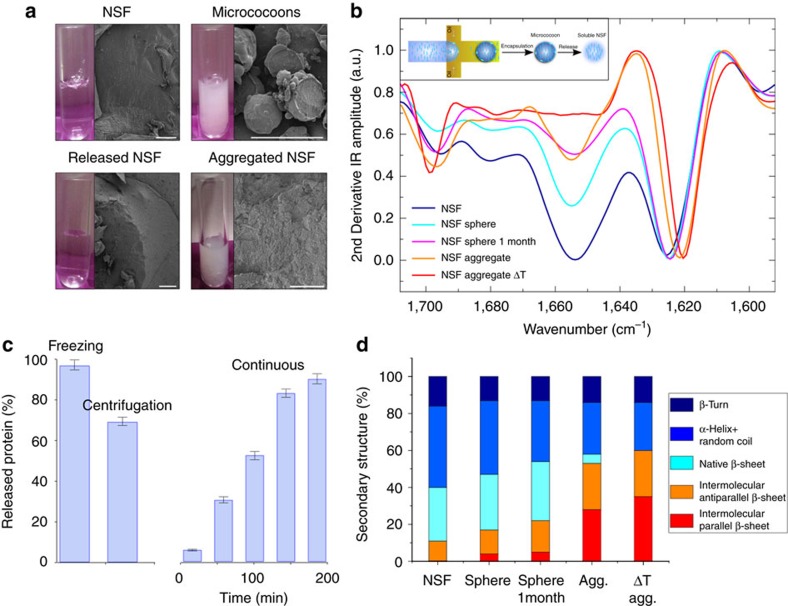
Figure 4. NSF long-term storage and release.
(a) Cryo-SEM micrographs showing the morphology of (from left to right) soluble NSF, NSF micrococoons, released and aggregated NSF. Scale bars, 100 μm; The corresponding images of NSF solutions are shown as inserts (left); (b) FTIR spectra of the aggregation and release of NSF by snap-freezing in liquid nitrogen. Insert: schematic representation of the formation of spherical NSF micrococoons and NSF release from micrococoons; (c) histogram showing the efficiency of NSF release by snap-freezing, gentle centrifugation and continuous washing of the NSF micrococoons. The indicated error bars are the s.d. of the average of three different repeats, each one measure 12 times. (d) Histogram of NSF secondary structure elements calculated from the amide I band in the FTIR spectra (b) after release from the microncapsules.

