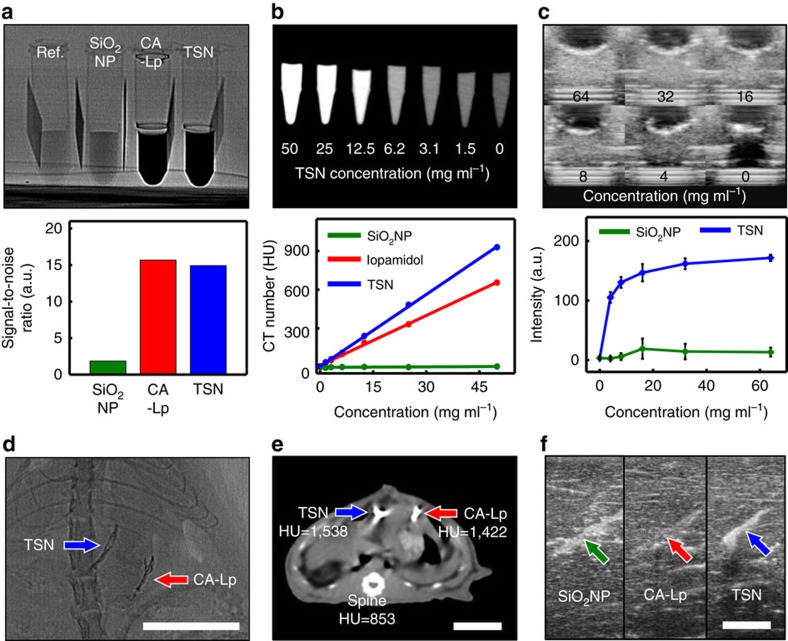
Figure 3. Contrast enhancement of TSNs on various imaging modalities in vitro and in vivo.
(a) Contrast enhancement on X-ray fluoroscopy. Fluoroscope image of the tubes containing water (Ref.), commercial silica nanoparticle solution (SiO2 NPs, 50 wt%), mixture of cyanoacrylate adhesive and iodized oil (CA-Lp, 75% of Lipiodol, 360 mg ml−1 of iodine), and TSNs (40 wt%), and bar plot of the calculated signal to noise ratio from the image). (b) Contrast enhancement on computed tomography (CT). CT image of microtubes containing serially diluted TSNs, and line graph of CT contrast enhancement of SiO2 NPs, contrast agent (iopamidol), and TSNs against their concentrations. (c) Contrast enhancement on ultrasonography. Ultrasonography images of TSN phantoms, and a plot of the mean intensities with s.d. of TSNs and SiO2 NPs against their concentrations. (d,e) In vivo images of a Sprague Dawley (SD) rat after application of TSNs and CA-Lp on fluoroscopy (d) and CT (e). On the CT image (e), the mean CT values (Hounsfield unit, HU) of each region of interest (TSN, CA-Lp, and bone) were measured. (f) Ultrasonography images of the calf liver where SiO2 NPs, CA-Lp and TSNs were injected. Scale bars in d–f indicate 2 cm.

