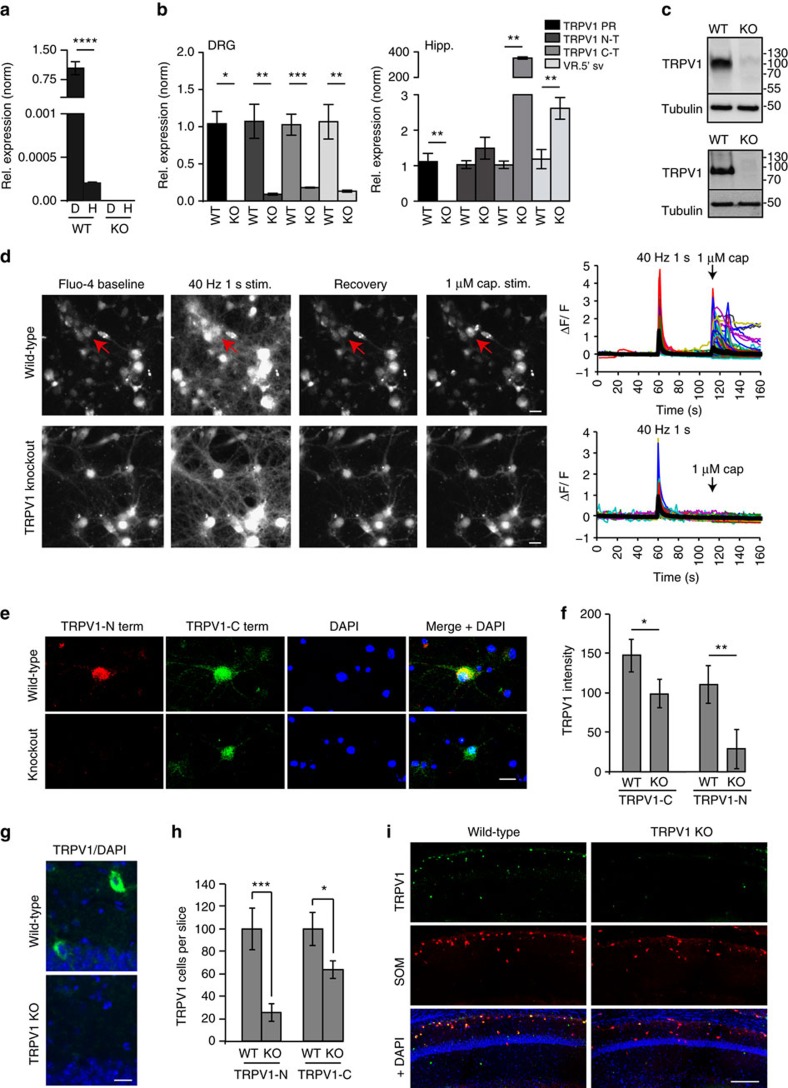
Figure 1. Expression of TRPV1 in the hippocampus.
(a) qPCR showing relative mRNA expression levels of the TRPV1 pore region in DRG (D) and hippocampus (H), normalized to WT DRG levels. (b) qPCR showing relative mRNA expression levels of the TRPV1 N-T, C-T and pore regions (PR), and of the VR.5′sv splice isoform in DRG (left) and hippocampus (right) normalized to WT (n=3 repetitions; error=s.e.m., significance determined by unpaired Student’s t-test with Welch’s correction; *P<0.05, **P<0.01, ***P<0.001, ****P<0.0001). (c) Western blot confirming that the N-terminal TRPV1 antibody recognizes TRPV1 in WT but not in TRPV1 KO homogenates from whole brain (upper) and hippocampus (lower). Tubulin served as a loading control; n=3 repetitions. (d) Images of Fluo-4-based Ca2+ responses in dissociated WT and TRPV1 knockout hippocampal cultures before, during and after field stimulation and after capsaicin addition (left); scale bar, 20 μm. Right panels show representative (coloured) and average (black) traces of Fluo-4 signal. Red arrows indicate A WT neuron that responded to 1 μM capsaicin treatment; no response was observed in TRPV1 KO cultures (n=18 time-lapse recordings; 3 cultures) or to DMSO, used as a negative control (n=16 recordings; three cultures). (e) The N-terminal TRPV1 antibody detects a subset of WT hippocampal neurons positive for TRPV1, and signal is absent in TRPV1 KO neurons (n=6; two cultures). The C-terminal TRPV1 antibody detects the same sub-population of WT hippocampal neurons, but signal remains in TRPV1 KOs; scale bar, 20 μm. (f) Quantitation of N-terminal and C-terminal TRPV1 antibody signal in WT and TRPV1 KO hippocampal neurons (n=12; 4 cultures; error=s.e.m., significance determined by unpaired Student’s t-test with Welch’s correction **P<0.01, ***P<0.001). (g) Immunostain of TRPV1 and DAPI showing TRPV1-positive cells in the stratum oriens in WT hippocampal sections, compared to TRPV1 KOs; scale bar, 20 μm. (h) Quantification of number of neurons positive for N-terminal or C-terminal TRPV1 antibody signal in WT and TRPV1 KO hippocampal sections (n=5 sections each; error=s.e.m., significance determined by unpaired Student’s t-test with Welch’s correction *P<0.01, **P<0.01, ***P<0.001). (i) Immunostain of TRPV1, somatostatin (SOM) and DAPI in WT and TRPV1 KO hippocampal sections; scale bar, 100 μm.

