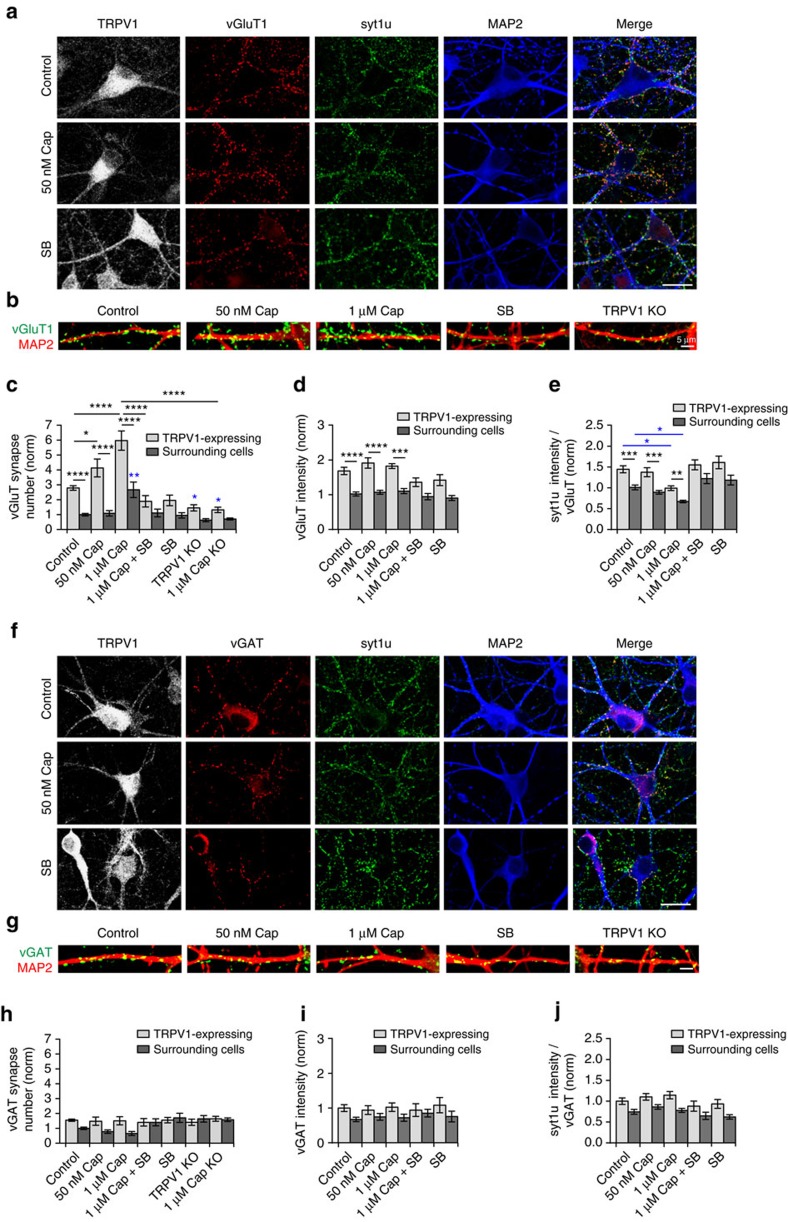
Figure 4. Post-synaptic TRPV1 promotes excitatory innervation.
(a) Quadruple immunocytochemistry images of hippocampal neurons immunostained for TRPV1, vGluT1, syt1 lumenal antibody internalized by recycling synaptic vesicles during depolarization, and MAP2, in the indicated conditions; scale bar, 20 μm. (b) Higher magnification images of vGluT1 and MAP2 on TRPV1-expressing neurons in hippocampal cultures; scale bar, 5 μm. (c) Quantification of excitatory synapse number on TRPV1-positive hippocampal neurons normalized to surrounding cells in the indicated conditions. Black asterisks indicate significance between TRPV1-expressing and surrounding neurons in each condition. Blue asterisks indicate significance relative to control for either TRPV1-expressing cells or surrounding cells. (d) Quantitation of vGluT1, and syt1 uptake (e) intensity in presynaptic terminals contacting TRPV1-expressing neurons, normalized to surrounding neurons, in the indicated conditions. Images used for quantitation were: WT control n=24, WT 50 nM cap. n=12, WT 1 μM cap. n=9, WT 1 μM cap. + 1 μM SB n=12, WT 1 μM SB n=12, TRPV1 KO control n=9, TRPV1 KO 1 μM cap. n=9; from five different cultures. (f) Immunostains of TRPV1, vGAT, lumenal syt1 antibody internalized by recycling synaptic vesicles during depolarization, and MAP2 in the indicated conditions; scale bars, 20 μm. (g) Higher magnification images of vGAT and MAP2 immunostaining; scale bars, 5 μm. (h) Quantitation of inhibitory synapse number (number of vGAT-positive puncta) on TRPV1-expressing neurons normalized to surrounding cells. (i) Quantitation of vGAT intensity in presynaptic terminals contacting TRPV1-expressing neurons, normalized to surrounding neurons, in the indicated conditions. (j) Quantitation of syt1 uptake in depolarizing conditions in vGAT-positive terminals contacting TRPV1-expressing neurons, normalized to surrounding neurons, in the indicated conditions. Images used for quantitation were: WT control n=23, WT 50 nM cap. n=11, WT 1 μM cap. n=9, WT 1 μM cap.+ 1 μM SB n=12, WT 1 μM SB n=12, TRPV1 KO control n=9, TRPV1 KO 1 μM cap. n=9; from 5 cultures. Error=s.e.m., significance determined by one-way ANOVA with Tukey's post hoc test for multiple comparisons, *P<0.05, **P<0.01, ***P<0.001, ****P<0.0001; fluorescence intensity and synapse number for all conditions was normalized to the corresponding average value for surrounding neurons in WT cell cultures.

