
Figure 1.
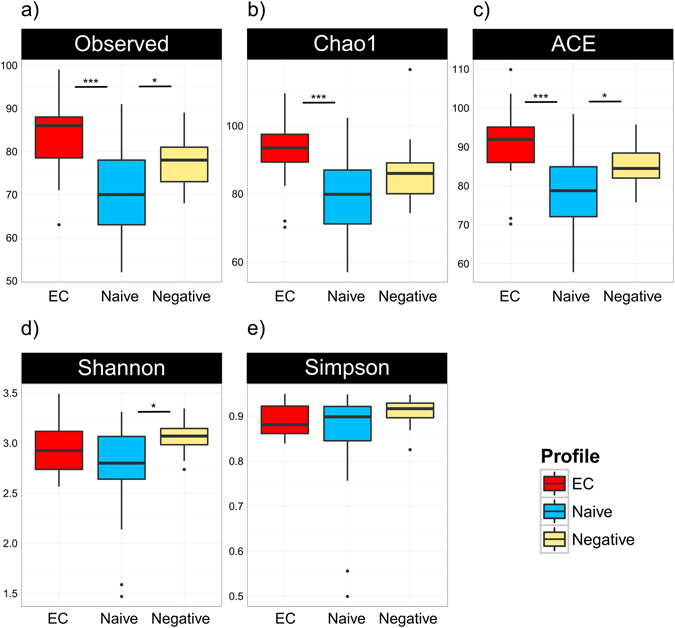
Similar richness and diversity of fecal microbiota in EC and negative controls. Number of observed bacterial genera was significantly lower in naive patients as compared to the other groups (a). Richness indices Chao-1 (b) and ACE (c) were reduced in naive, but no significant differences were observed between EC and negative. Alpha-diversity, assessed by Shannon index was lower in naive as compared to negative (d), whereas Simpson index was similar in all groups (e). Comparisons between groups were obtained via Kruskal-Wallis rank based test including Dunn’s post-hoc pairwise analyses. Benjamini-Hochberg method was used for correction of multiple testing. A p-value < 0.05 was considered significant. Box plots represent median (black horizontal line), 25th and 75th quartiles (edge of boxes), upper and lower extremes (whiskers). Outliers are represented by a single data point.