
Figure 3.
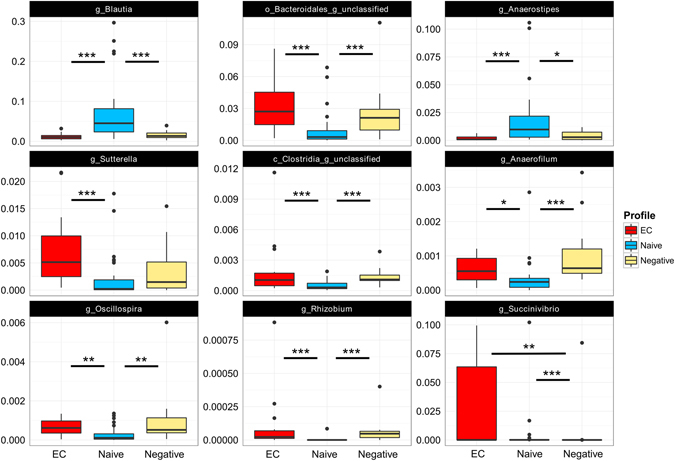
Compositional differences in fecal microbiota between groups. Several differences in bacterial abundance were observed between the groups at genus level. Comparisons of taxa abundances were performed via Kruskal -Wallis rank based test and Benjamini-Hochberg method was used for correction of multiple testing. Adjusted p-value < 0.01 was considered significant for Kruskal-Wallis. Dunn’s post-hoc pairwise analyses: *p < 0.05, **p < 0.01, ***p < 0.001. Box plots represent median (black horizontal line), 25th and 75th quartiles (edge of boxes), upper and lower extremes (whiskers). Outliers are represented by a single data point.