
Figure 5.
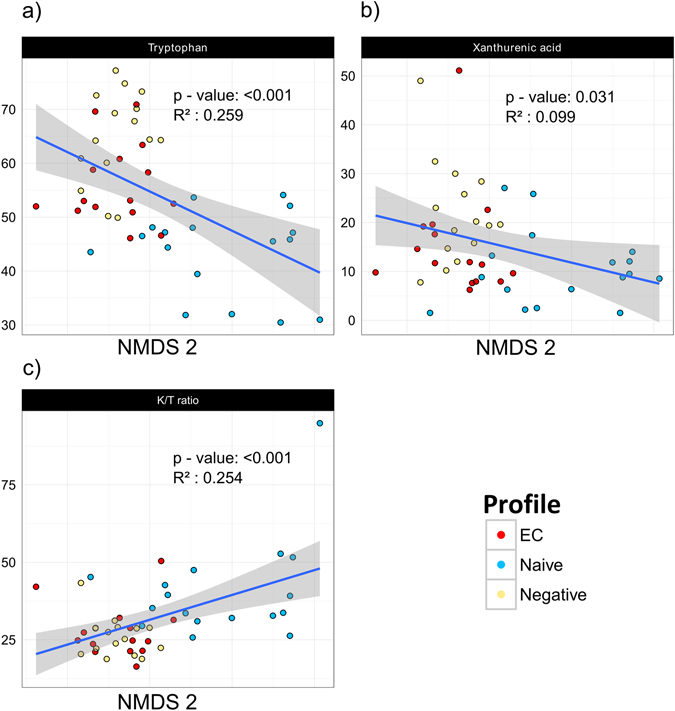
Correlations between tryptophan catabolism metabolites and NMDS 2 axis reveal clustering of naive patients. Significant correlations between NMDS 2 axis and tryptophan (a), xanthurenic acid (b) and K/T ratio (c) were observed, separating naive patients from EC and negative controls. The gray area defines the 95% confidence interval for the linear regression coefficients. The different groups are represented by different colors (EC-red, naive-blue, negative-yellow). Spearman’s correlation was applied for testing correlations between metabolites and NMDS plot axis coordinates.