
Figure 2.
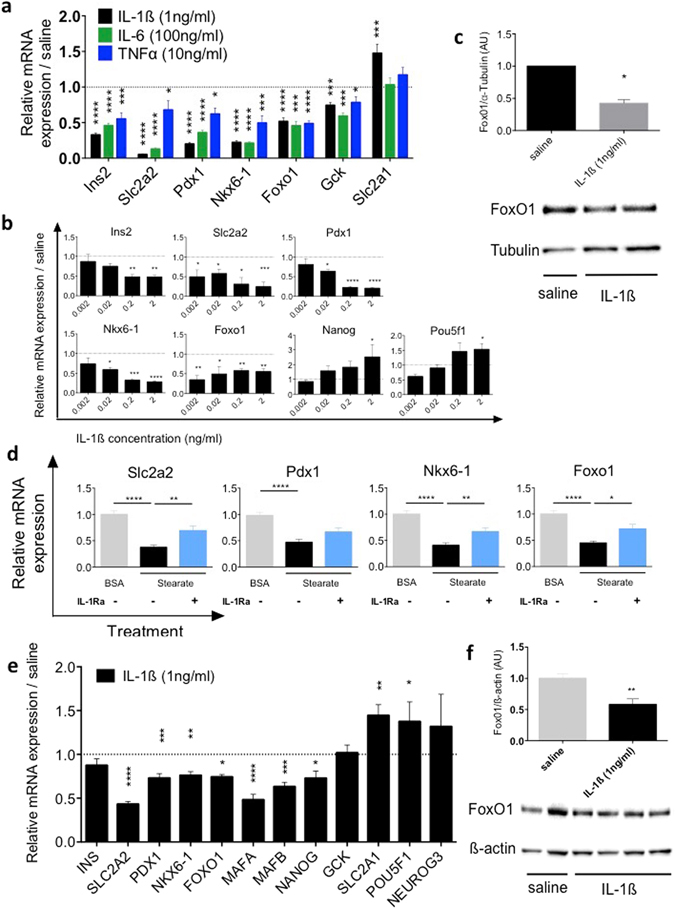
Cytokine induced β-cell dedifferentiation. (a) mRNA expression levels of Insulin (Ins2), GLUT2 (Slc2a2), Pdx1 and Nkx6-1, Foxo1, glucokinase (Gck) and GLUT1 (Slc2a1) in mouse islets after 24 hours of treatment with 1ng/ml of IL-1β, 100ng/ml of IL-6 and 10 ng/ml of TNFα relative to solvent (dashed line). (b) mRNA expression levels in mouse islets after 24 hours of exposure to various concentrations of IL-1β relative to solvent (dashed line). (c) Protein quantification and a representative Western blot of FoxO1 in mouse islets after 24 hours treatment with IL-1β (1 ng/ml) or saline. (d) mRNA expression levels in mouse islets after 24 hours treatment with 0.25 mM of stearate in the absence (black bars) or presence of the IL-1 receptor antagonist IL-1Ra (1 μg/ml; blue bars) compared to solvent (BSA). (e) mRNA expression levels in human islets after 24 hours of IL-1β (1 ng/ml) treatment relative to solvent (dashed line). (f) Protein quantification and a representative Western blot of FoxO1 in human islets after 24 hours of IL-1β (1 ng/ml). (a) n = 12. (b) n = 9. (c) n = 3–5. (d) n = 14–16. (e) n = 9–10. (f) n = 6–8. All sample sizes represent the sum of 3 independent experiments. *P < 0.05, **P < 0.01, ***P < 0.001, ****P < 0.0001 of treatment group vs. untreated control. Statistical significance (P) was determined using the two-tailed Mann-Whitney U (Fig. a,c–f) and one-way ANOVA (Fig. b). All error bars denote s.e.m.