
Figure 3.
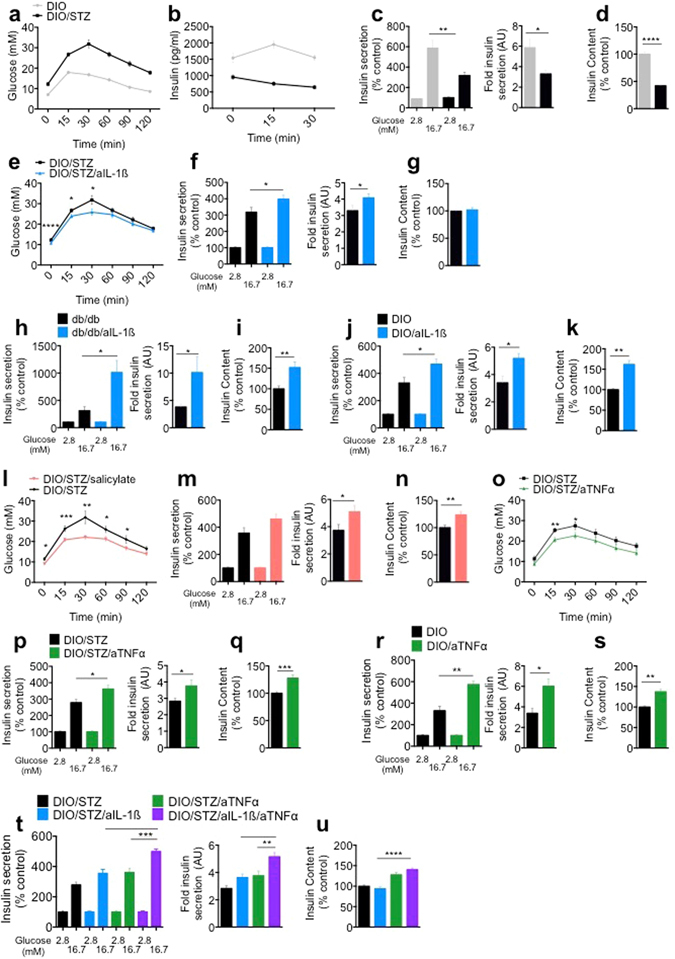
In vivo anti-inflammatory treatment ameliorates diabetic phenotype and improves β-cell insulin secretion capacity. (a) Glucose levels and (b) corresponding insulin levels following an ipGTT in DIO and DIO/STZ mice. (c,d) GSIS, corresponding fold insulin secretion and insulin content of isolated islets from DIO and DIO/STZ mice. (e) Glucose levels following an ipGTT in DIO/STZ mice ± anti-IL-1β (aIL-1β). (f,g) GSIS, corresponding fold insulin secretion and insulin content of isolated islets from DIO/STZ mice ± aIL-1β. (h–k) GSIS, corresponding fold insulin secretion and insulin content of isolated islets from (h,i) db/db mice ± aIL-1β treatment for 2 weeks and (j,k) DIO mice ± aIL-1β treatment for 8 weeks. (l) Glucose levels following an ipGTT in DIO/STZ mice ± sodium salicylate. (m,n) GSIS, corresponding fold insulin secretion and insulin content of isolated islets from DIO/STZ mice ± sodium salicylate treatment. (o) Glucose levels following an ipGTT in DIO/STZ mice ± anti TNFα (aTNFα) treatment. (p,q) GSIS, corresponding fold insulin secretion and insulin content of isolated islets from DIO/STZ mice ± aTNFα treatment. (r,s) GSIS and corresponding fold insulin secretion of isolated islets from DIO mice ± aTNFα treatment for 8 weeks. (t,u) GSIS, corresponding fold insulin secretion and insulin content from DIO/STZ mice ± aTNFα/aIL-1β treatment. (a,b) n = 19 each, 3 experiments. (c,d) n = 18 each, 3 experiments. (e) n = 19 each, 3 experiments. (f,g) n = 18 each, 3 experiments. (h,i) n = 6 each, 1 experiment. (j,k) n = 5 each, 1 experiment. (l) n = 14 each, 2 experiments. (m,n) n = 12 each, 2 experiments. (o) n = 11 each, 2 experiments. (p,q) n = 12 each, 2 experiments. (r,s) n = 6 each, 1 experiment. (t,u) n = 12 each, 2 experiments. n represents the number of mice in in vivo experiments and biological replicates in experiments with isolated islets. *P < 0.05, **P < 0.01, ***P < 0.001, ****P < 0.0001. Statistical significance (P) was determined using the two-tailed Mann-Whitney U (Fig. a-s) and one-way ANOVA (Fig. t,u). All error bars denote s.e.m. DIO, diet-induced obese; DIO/STZ, diet-induced obese/streptozotocin; ipGTT, intraperitoneal glucose-tolerance test.