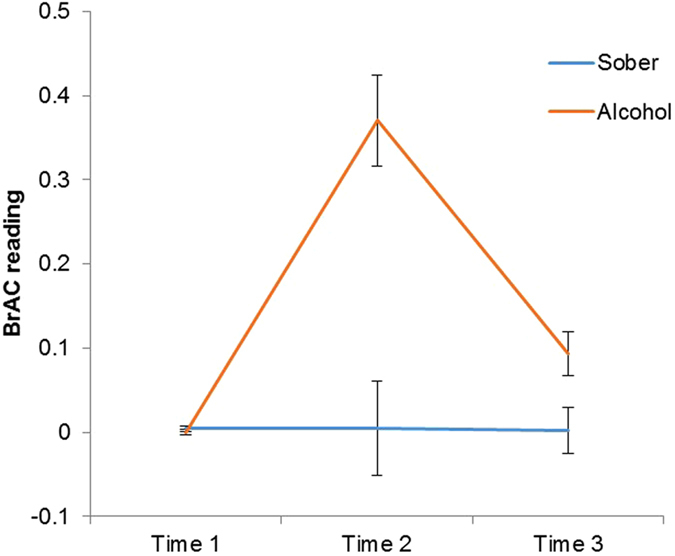
Figure 3.

The average breath alcohol content (BrAC) readings for both the alcohol and sober conditions at three different time points (before drinking; following drinking; the morning after drinking) throughout the duration of the experiment, with standard error bars. There were significant differences between groups following drinking, both at time two (p < 0.001) and time three (p < 0.001). There were no significant group differences before drinking.
