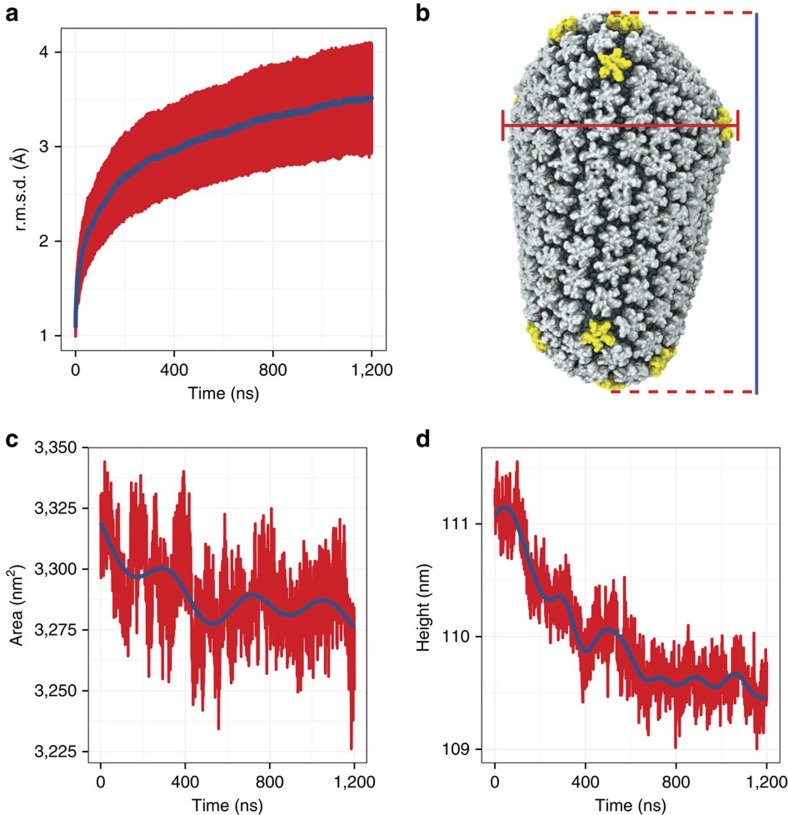
Figure 2. Stability of the HIV-1 capsid.
(a) Time evolution of the root mean squared deviation (r.m.s.d.) for hexamers and pentamers, and the moving average with a window size of 10 ns is shown in blue. (b) For all area and height calculations, the three principal moments of inertia of the entire capsid define the x, y and z axes. The cross-sectional area is estimated as the area of an ellipse where the major and minor axes are the maximal distance between parts of the capsid along the  and
and  axes. The height of the capsid is defined as the longest distance from the tip (bottom) to the base (top) along the
  axis. (c) Time evolution of the capsid’s cross-section, and the moving average with a 10 ns window size is shown in blue. (d) Time evolution of the height of the HIV-1 capsid; the moving average with a 10 ns window size is shown in blue.

