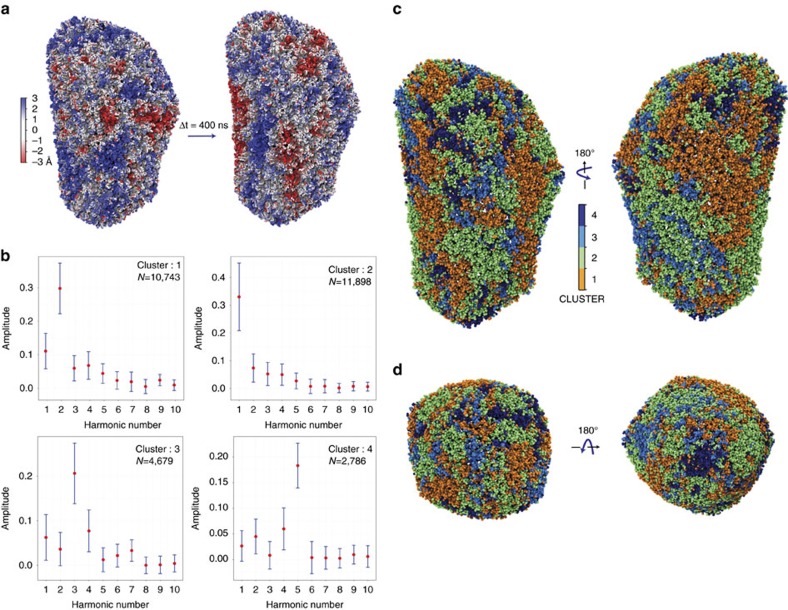
Figure 5. Acoustic properties of the HIV-1 capsid during the last 400 ns of simulations.
(a) Structural fluctuations of the capsid observed between two states separated 400 ns apart, ranging from −3 to +3 Å (red to blue). (b) Periodograms of the time series of the capsid motions. Four classes of periodograms were found: the two largest classes (N=10,743 and N=11,898) are dominated by the two lower fundamental frequencies (2.38 and 4.76 MHz); conversely, the two smallest classes (N=4,679 and N=2,786) are dominated by two higher fundamental frequencies (7.14 and 11.9 MHz). The medoids of each class are represented in red dots in b. The s.d. within each class is represented in blue error bars. (c) Projection of the periodogram clusters onto the structure of the capsid indicating the location of each cluster. (d) Top (base) and bottom (tip) view of the capsid coloured by the periodogram clusters. The four clusters are coloured orange, green, cyan and dark blue, respectively.

