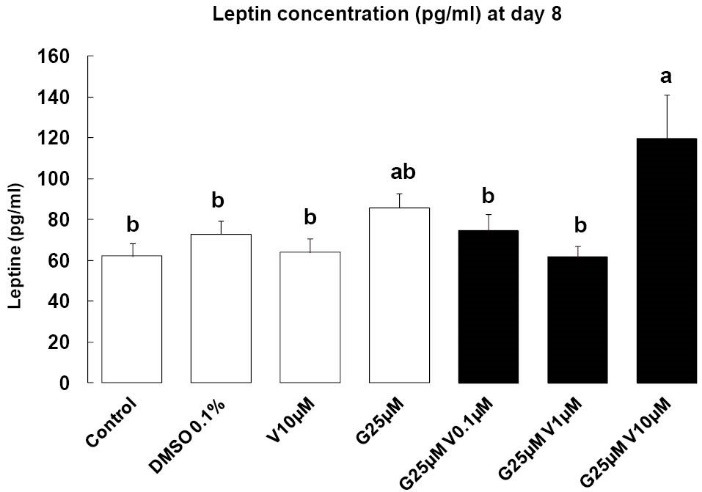
Fig. 5.

Leptin syntheses. Effects of endocrine disruptors treatments on leptin synthesis (pg/mL) by 3T3-L1 cell at the day 8th of culture. Treatments were administered for 2 days simultaneously to the mix of differentiation induction. Each bar represents the mean ± SEM. Means which are denoted by: different letters (a, b) indicate significantly different values (Newman-Keuls, P<0.05). (n = 3 independent experiments in triplicate)
