
Figure 1. Sex rather than cell type drives global DNA methylation patterns.
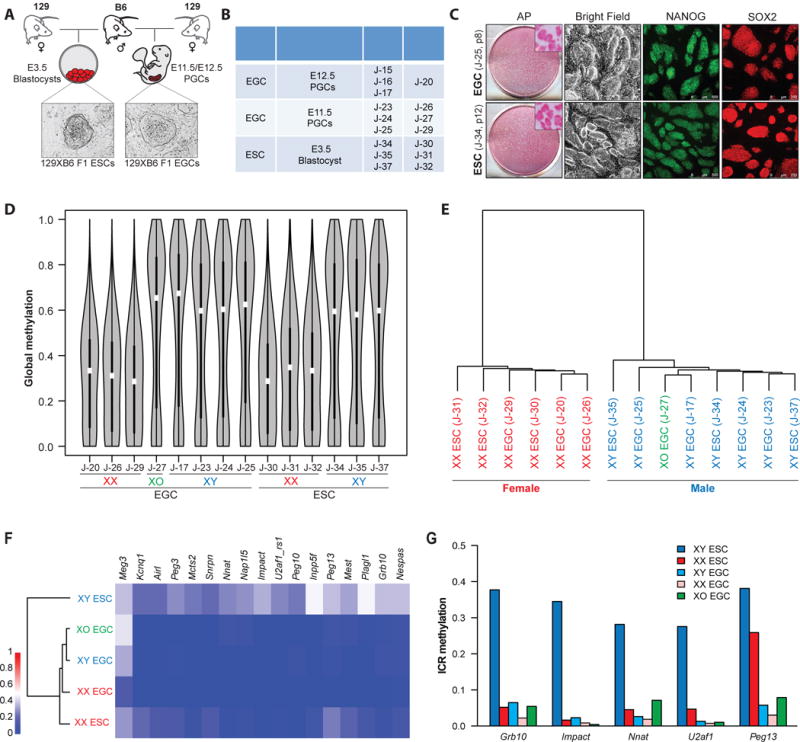
(A) Schematic of the generation of genetically matched ESCs and EGCs.
(B) Detailed information on the established ESCs and EGCs. ESCs and EGCs were collected between passages 4–6 for all experiments unless otherwise specified.
(C) EGCs (top panels) and ESCs (bottom panels) express alkaline phosphatase (AP), NANOG and SOX2. Insets show magnification of AP+ colonies.
(D) Global methylation analysis of isogenic ESC and EGC lines by reduced representation bisulfite sequencing (RRBS) using violin plot representations. Blue color represents XY cells, red color represents XX cells, green represents XO cell line.
(E) Unsupervised hierarchical clustering of RRBS samples shown in Figure 1D. Blue color represents XY cells, red color represents XX cells, green represents XO cell line.
(F) Dendrogram and heatmap representation of imprinted loci in isogenic ESC (n=6) and EGC (n=8) lines.
(G) Average methylation levels across imprinting control regions (ICRs) at indicated loci. Average values of methylation levels for 3 XY ESCs (dark blue), 3 XX ESCs (dark red), 4 XY EGCs (light blue), 3 XX EGCs (light red) and 1 XO EGC (green) line are shown, respectively, for each analysis.
See also Figures S1 and S2.