
Figure 2. Ratio of X chromosomes to autosomes correlates with global methylation levels in pluripotent cell lines.
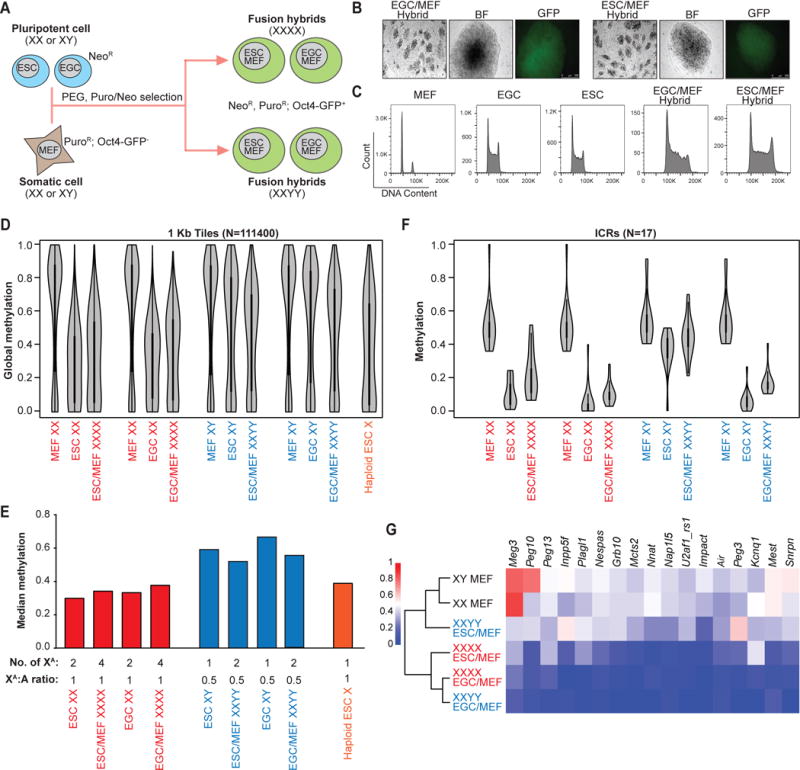
(A) Schematic of the generation of ESC/EGC-somatic hybrids.
(B) Representative ESC/MEF hybrids and EGC/MEF hybrids show activation of somatically silenced Oct4-EGFP reporter.
(C) Representative EGC/MEF and ESC/MEF hybrids show tetraploid DNA content compared to parental fusion partners using propidium iodide (PI) staining.
(D) Global methylation levels of 4n ESC-somatic and EGC-somatic hybrids and their respective 2n fusion partners as determined by RRBS analysis. One representative line for each cell type was shown. A haploid ESC (X) line was included as a control in D–E.
(E) (Top) Median global methylation levels of 4n hybrids and their respective 2n fusion partners from Figure 2D are shown. (Bottom) The number of presumed active X chromosomes (XA) for each line and the ratio of XA to autosomes (A) are shown.
(F) Methylation levels of all captured imprinted loci from ESC/EGC-somatic hybrids and their fusion partners from Figure 2D as measured by RRBS analysis.
(G) Dendrogram and heatmap representation of imprinted methylation in ESC/EGC-somatic hybrids and their somatic fusion partners. Average methylation levels across ICRs of 2 XXYY ESC/MEF hybrids, 2 XXYY EGC/MEF hybrids, 3 XXXX ESC/MEF hybrids, 3 XXXX EGC/MEF hybrids, 1 XY MEF and 1 XX MEF line are shown. XXYY, blue; XXXX, red; XX and XY MEF (black).
See also Figure S3.