
Figure 3. Male and female ICMs are similarly hypomethylated.
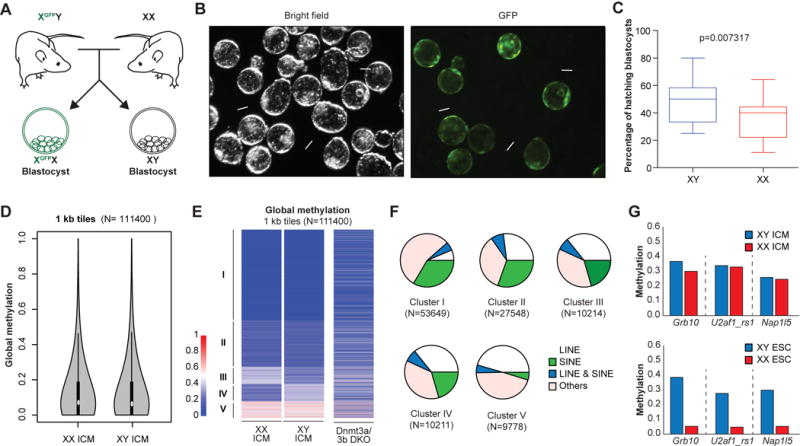
(A) Schematic of the generation of XGFPX and XY blastocysts.
(B) (Left) Representative bright field image of XGFPX and XY blastocysts and (right) GFP-positive XGFPX blastocysts are shown. White arrows indicate hatching XY blastocysts.
(C) The percentage of hatching XGFPX and XY blastocysts from the same litter is plotted. 123 XGFPX and 104 XY blastocysts from 11 independent litters were scored. Data is judged to be statistically significant when p < 0.05 by two-tailed Student’s T-TEST.
(D) Global methylation analysis of pooled XX (n=29) and XY (n=20) ICMs by RRBS using violin plot representation.
(E) Comparison of genome-wide DNA methylation patterns by RRBS in XX and XY ICMs. Global methylation patterns are classified into 5 clusters. Dnmt3a/b DKO cell line was included as a control.
(F) Compositions of each cluster from Figure 3E are shown as pie charts.
(G) Average methylation levels across imprinting control regions (ICRs) for indicated loci from ICM (top; 20 XY and 29 XX ICMs) and ESC (bottom; 3 XY and 3 XX lines) cells.
See also Figure S4.