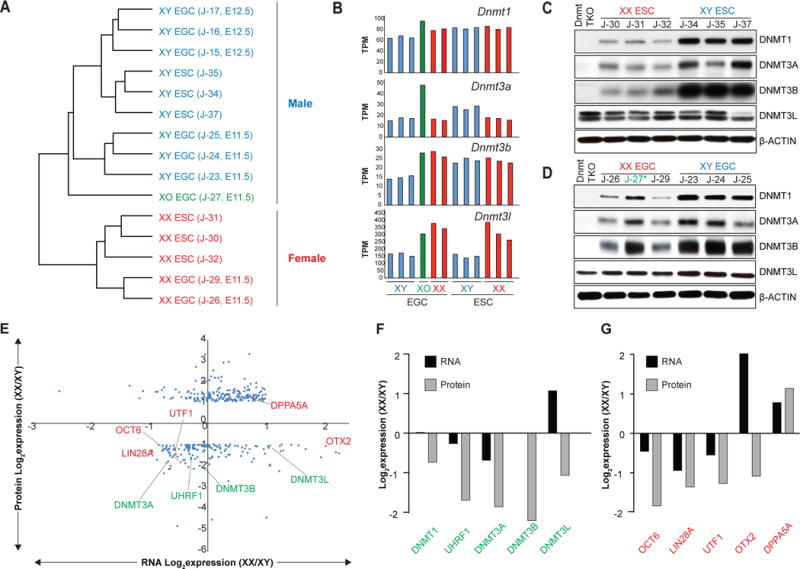
Figure 4. Post-transcriptional gene regulation in female ESCs.

(A) Unsupervised hierarchical clustering of RNA-seq data obtained from isogenic ESC and EGC lines.
(B) mRNA levels for Dnmt1, Dnmt3a, Dnmt3b, and Dnmt3l in isogenic ESC and EGC lines.
(C–D) Western blot analyses for DNMT1, DNMT3A, DNMT3B, DNMT3L in isogenic XX and XY ESC (C) and EGC (D) lines. See Figure S5B and S5C for quantification. Blue color represents XY cells, red color represents XX cells, green (*) represents XO cell line
(E) Correlation between RNA-Seq (3 XX and 3 XY ESC lines) and proteomics (2 replicates per ESC line) data. 193 proteins were found to be upregulated in female ESCs compared to male ESCs even though corresponding RNAs did not change (n=189) or were downregulated (n=4). By contrast, 161 proteins were found to be downregulated in female ESCs compared to male ESCs even though corresponding RNAs did not change (n=143) or were upregulated (n=18). Differentially expressed proteins between male and female ESCs (> 2-fold) were plotted along the y-axis; corresponding differentially expressed RNAs were plotted along the x-axis. Expression levels of DNA methyltransferases and cofactors (green) as well as naïve and primed pluripotency markers (red) are highlighted.
(F) Differential expression of DNA methyltransferases and cofactors from Figure 4E (green) is shown at the RNA (black) and protein (grey) levels.
(G) Differential expression of naïve or primed pluripotency markers from Figure 4E (red) is shown at the RNA (black) and protein (grey) levels.
See also Figure S5 and Table S1–4 and 7.
