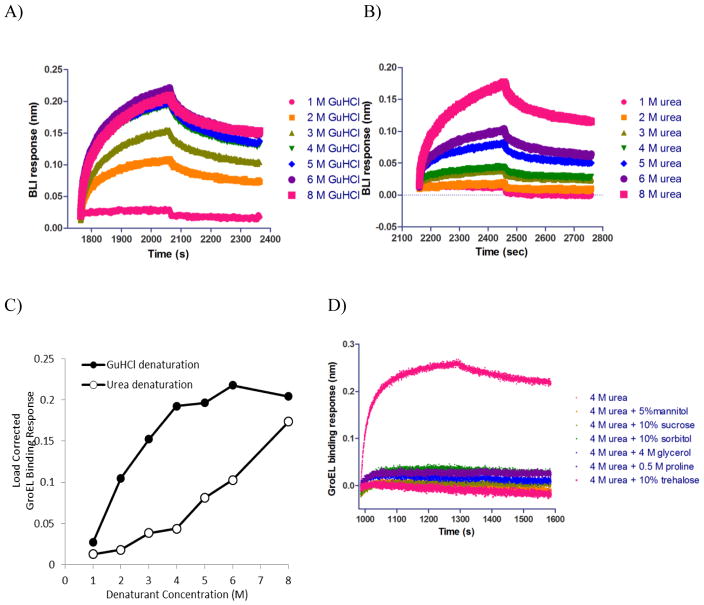
Figure 8.
Generation of IgG kinetic isothermal denaturation curves and assessing osmolyte stabilization effect: A) Aligned sensorgram traces (raw data) showing GroEL association and dissociation steps after GnHCl pulse. GroEL binding showed a GnHCl concentration dependent response. The higher GnHCl concentration that was used in a previous denaturation step, the larger the GroEL binding response was. GroEL binding signal appeared to approach saturation with 5 M GnHCl denaturation (GnHCl was titrated from 1 to 8 M). B) Aligned sensorgram traces (raw data) showing GroEL association and dissocation steps after urea pulse. GroEL binding also exhibited a urea concentration dependent response. Higher urea concentration led to higher GroEL binding signal. GroEL binding signal kept increasing within the urea concentration range that was titrated (1–8 M). C) Comparative GroEL binding responses as a function of GuHCl (black filled circles) or urea denaturant concentration (open circles). D) Aligned sensorgram traces (raw data) showing kinetic stabilization of IgG by different osmolytes/excipients.

