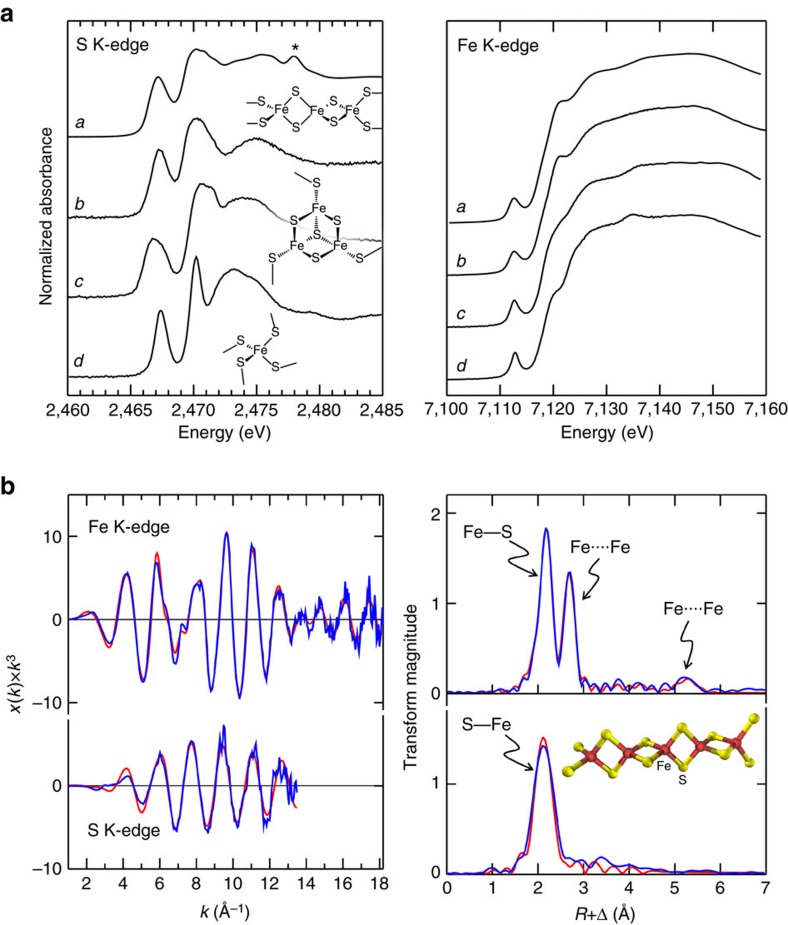
Figure 3. IssA X-ray absorption spectra.
(a) X-ray absorption near-edge spectra of IssA compared with a number of Fe–S proteins; a: IssA, b: linear 3Fe-4S cluster in human aconitase, c: P. furiosus 3Fe-4S ferredoxin and d: P. furiosus rubredoxin. The feature marked (*) in the IssA spectrum is due to a trace amount of sulfonate buffer. For both the S and Fe K-edge data, the IssA spectrum most resembles that of the linear 3Fe-4S cluster. (b) S and Fe K-edge EXAFS spectra, together with EXAFS Fourier transforms (S–Fe and Fe–S phase-corrected, respectively) showing experimental data (blue lines) together with best fits (red lines), the inset in the Fourier transform figure shows the structure used to compute the multiple scattering EXAFS. Best fits were computed with two S–Fe at 2.239(3) Å, σ2=0.0049(3) Å2 and four Fe–S at 2.243(1) Å, σ2=0.0044(1) Å2, two Fe····Fe at 2.704(1) Å, σ2=0.0032(1) Å2 and two Fe····Fe at 5.408 Å and σ2=0.0064 Å2.

