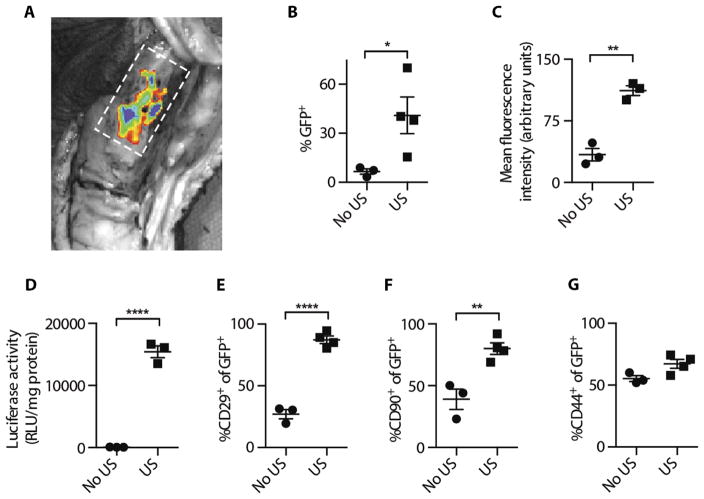
Fig. 1. Reporter gene expression in mini-pig tibial fractures after ultrasound-mediated gene delivery.
(A) Ex vivo fluorescence imaging of an exposed GFP-treated fracture 5 days after treatment. Fracture margins are represented by a dashed rectangle. (B) Flow cytometry analysis of the percentage of GFP+ cells isolated from fracture sites 5 days after treatment with or without ultrasound (*P = 0.049). (C) Mean fluorescence intensity per cell isolated from fractures 5 days after treatment with or without ultrasound (**P = 0.0013). (D) Luciferase enzyme activity in cells isolated from fracture sites 5 days after treatment with or without ultrasound (****P = 0.0001). Percentage of (E) CD29+ (****P = 0.0001), (F) CD90+ (**P = 0.0057), and (G) CD44+ cells (P = 0.0531) out of GFP+ cells isolated from fractures 5 days after treatment with or without ultrasound. Data are means ± SEM; P values were determined by two-tailed Student’s t tests (No US, n = 3; US, n = 4; RLU, relative light units).

