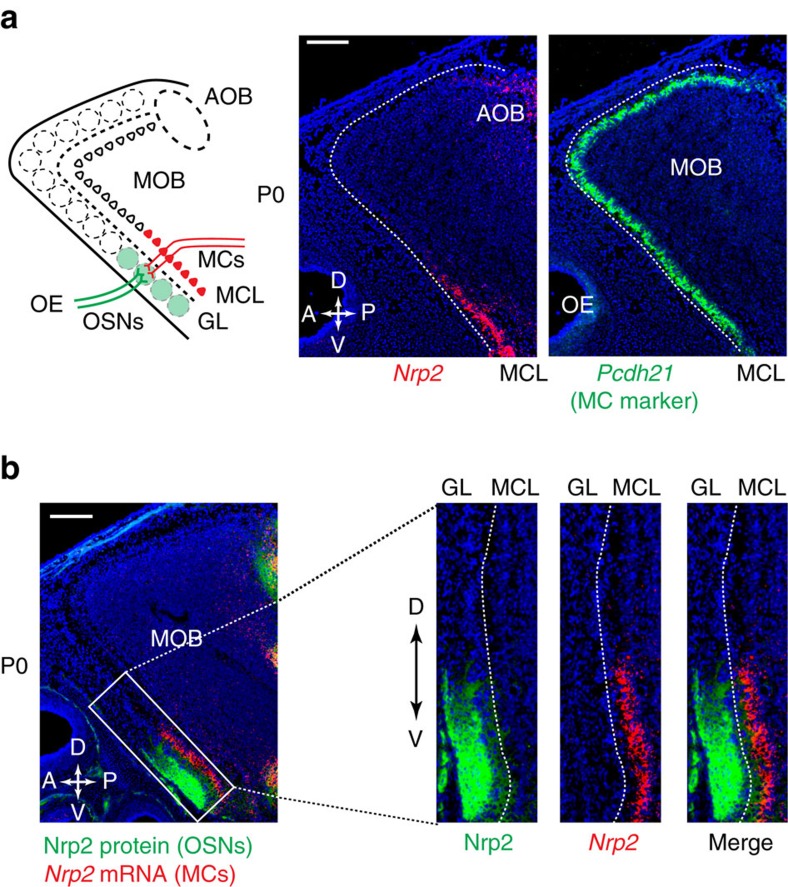
Figure 2. Distribution of Nrp2 in the GL and MCL of the MOB.
(a) Detection of Nrp2 transcripts in the ventral-region MCs. Parasagittal MOB sections (P0) were hybridized with Pcdh21 (MC marker) and Nrp2 probes. n=5. Nrp2 is expressed in the MCL, high in the ventral and low in the dorsal region. Nrp2+ signals seen in the PD region represent Nrp2+ MCs in the AOB. A schematic diagram of the mouse MOB is shown in the left. (b) Distribution of Nrp2 protein and Nrp2 transcripts in the MOB. MOB sections at P0 were immunostained with anti-Nrp2 antibodies or hybridized with the Nrp2 probe. Nrp2 and Nrp2 signals are distributed in parallel along the D–V axis in the GL and MCL, respectively. Enlarged photos are shown in the right. n=5. Scale bar, 200 μm.

