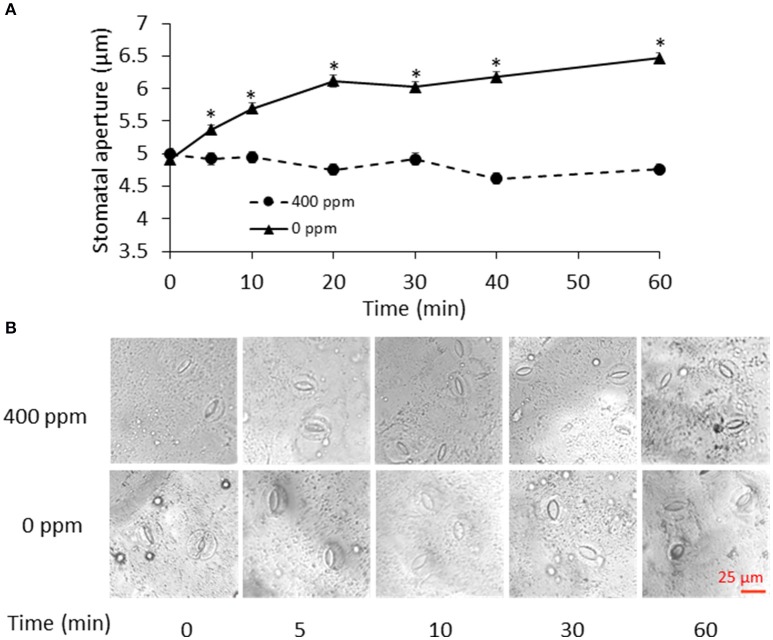
Figure 1.
Stomatal movement in response to low CO2. (A) Time course of stomatal movement under atmospheric (400 ppm) and low CO2 (0 ppm) conditions. Data are mean ± standard error of three independent experiments (n = 3) with 60 stomata counted for each replicate. *p < 0.05, Student's t-test. (B) Representative images of stomatal aperture during the control atmospheric CO2 and low CO2 treatments. Scale bar indicates 25 μm.

