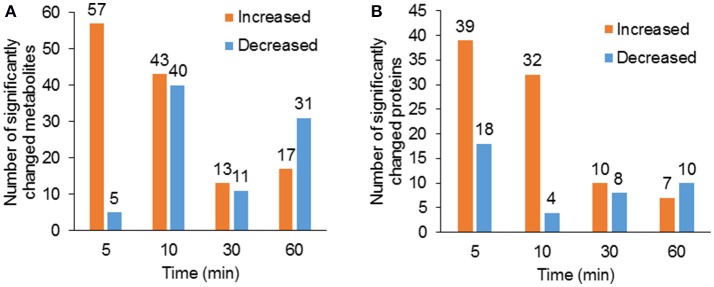
Figure 2.
Overview of significantly changed metabolites and proteins under low CO2 condition. (A) Total number of significantly increased (p < 0.05, fold change >1.2) and decreased (p < 0.05, fold change <0.8) metabolites at each time point of the treatment. (B) Total number of significantly increased and decreased proteins at each time point of the treatment.

