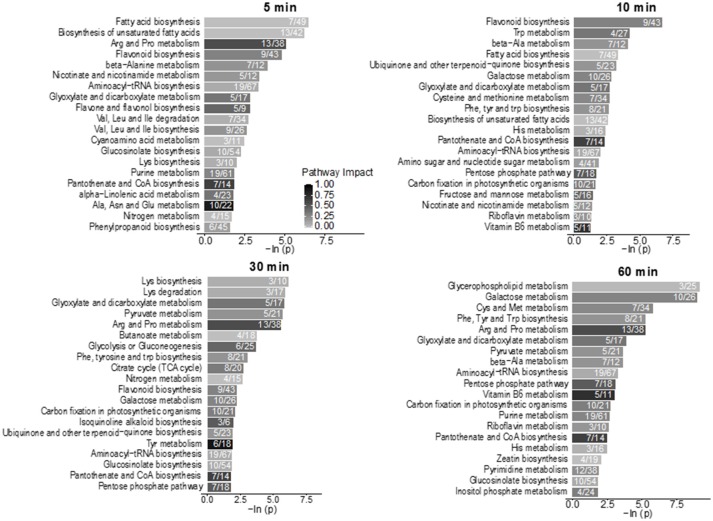
Figure 3.
Pathway enrichment analysis of the low CO2 responsive metabolites in the time-course study. Numbers inside the bars indicate the number of metabolites that matched to the total metabolites in that pathway. Only pathways with four or more metabolites that matched were included in the analysis. The scale bar of different levels of grayness indicates pathway impact.

