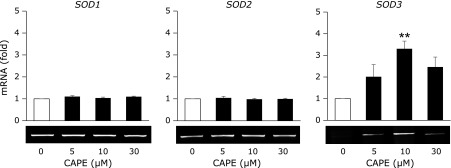
Fig. 2.
Effects of CAPE on the expression of SODs. HRECs were treated with the indicated concentrations of CAPE for 24 h. After cells had been treated, the level of each mRNA was measured by RT-PCR. RT-PCR data were normalized using 18S rRNA levels. Data were shown as the mean ± SE (n = 3). **p<0.01 vs untreated cells.

