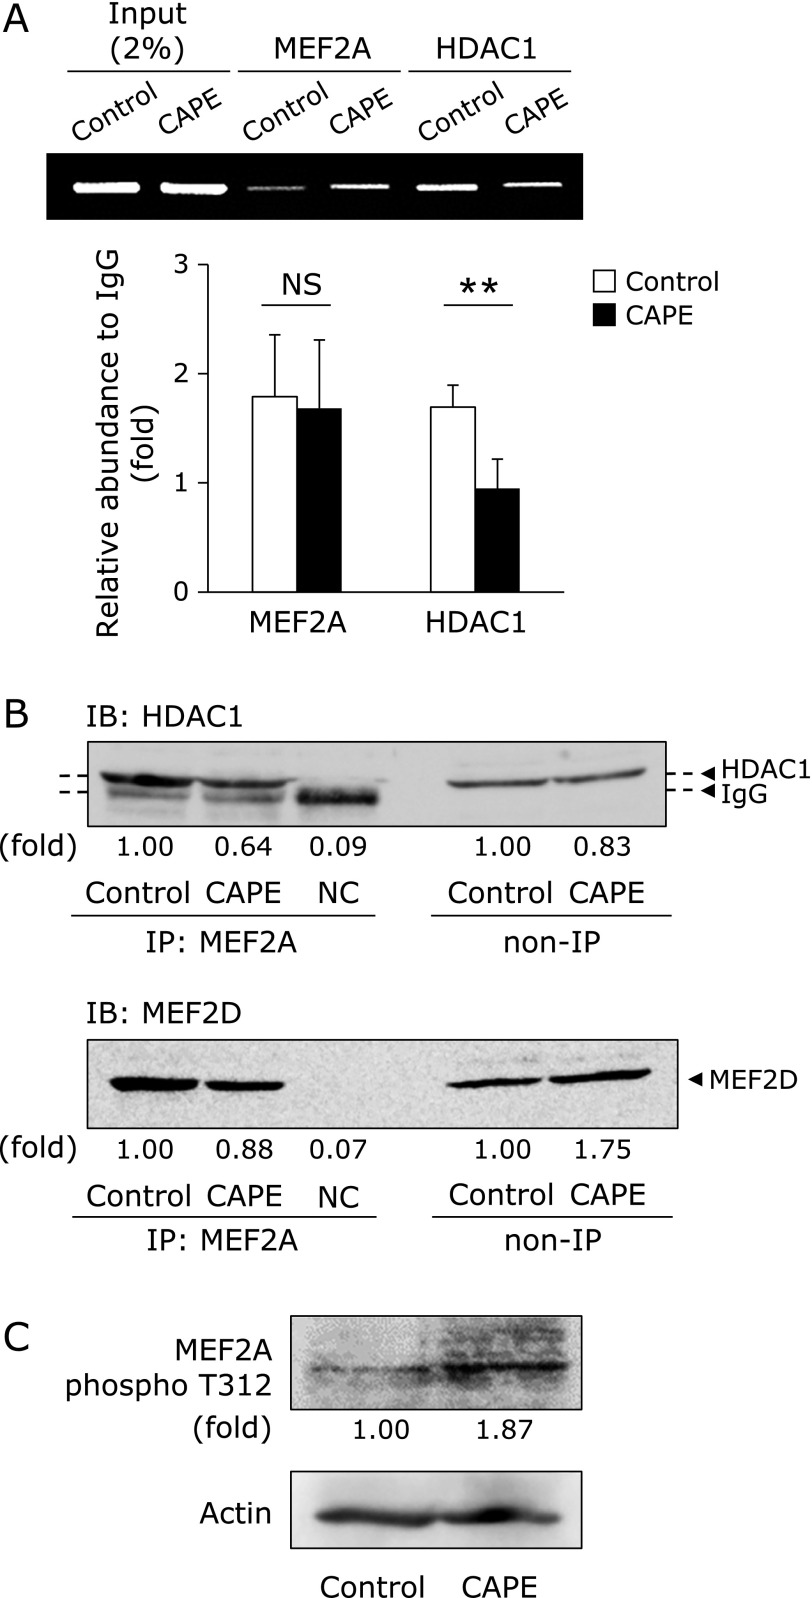
Fig. 5.
Effects of CAPE on the interaction between MEF2A and HDAC1. (A) HRECs were treated with 10 µM CAPE for 24 h. After cells had been treated, the ChIP assay was performed. Relative binding to the promoter region was expressed as a fold amount over input (2%). Data were shown as the mean ± SE (n = 4). **p<0.01, NS, not significant. (B) HRECs were treated with 10 µM CAPE for 24 h. After cells had been treated, the interaction between MEF2A and HDAC1 or MEF2D was assessed by IP. NC, negative control. (C) The phosphorylation of MEF2A threonine 312 (MEF2A phospho T312) was determined by Western blotting. Values (B and C) are expressed as fold change relative to the level of HDAC1 or MEF2D (B), or MEF2A phospho T312 (C) in control cells.

