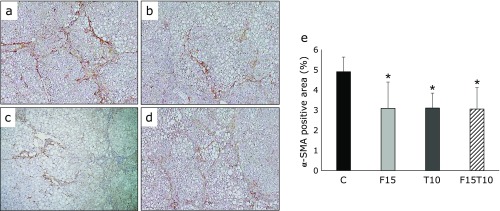
Fig. 3.
Immunohistochemical analysis of alpha-smooth muscle actin (α-SMA) expression in hepatic fibrosis. Paraffin-embedded rat liver sections were stained with α-SMA (40× magnification). (a) CDAA + DEN only group, (b) CDAA + DEN + 15 mg/kg/day furosemide group, (c) CDAA + DEN + 10 mg/kg/day tolvaptan group, (d) CDAA + DEN + 15 mg/kg/day furosemide + 10 mg/kg/day tolvaptan group. (e) Image analysis of α-SMA-positive areas. Data are presented as mean ± SD. *p<0.05 vs CDAA + DEN group.

