
Figure 7. Combining properties leads to a model with more predictive power.
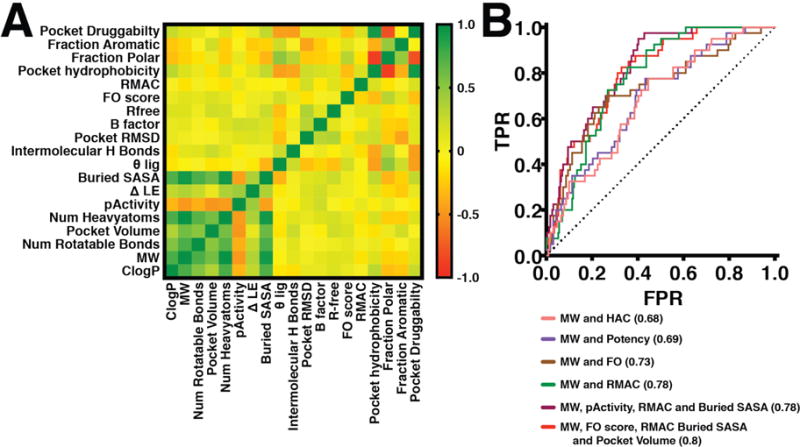
(A) Correlation in our test set between each of the properties considered: using this color gradient, uncorrelated properties are yellow. (B) Receiver operating characteristic (ROC) plots comparing the multiple-regression analysis based predictive powers of several different properties for predicting whether a ligand will change binding mode upon chemical elaboration. The performance of a random classifier is denoted by the black dotted line. The area under curve (AUC) for each of these properties is indicated.