
FIGURE 3.
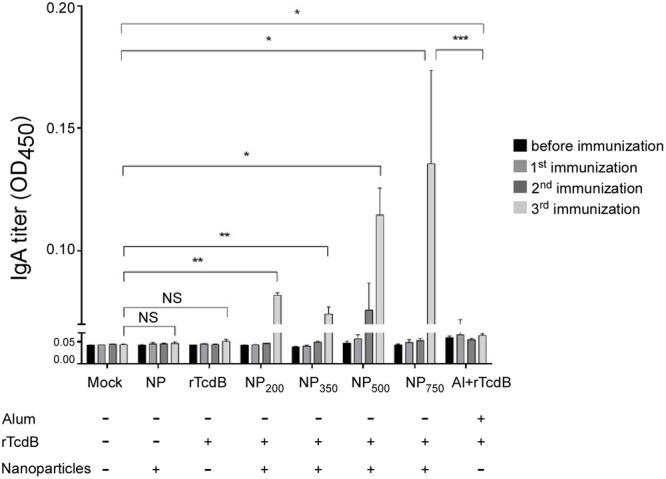
Induction of antigen-specific IgA in nanoparticle vaccinated mice. ELISA was performed in triplicate using coated peptide pool. Serum IgAs (1:1,000 dilution) in differentially immunized mice were compared (n = 5 per group). Mock: PBS injection only; NP: empty nanoparticle infection; rTcdB: injection with 20 μg purified rTcdB in PBS. NP200, NP350, NP500, and NP750: injection with NP-rTcdBs with the corresponding size in nanometers; Al+rTcdB: injection with 20 μg purified rTcdB mixed with Alum. All data are presented as mean ± standard deviations and statistical comparisons among groups were analyzed by Student’s t-test and ANOVA (n = 5, ∗p ≤ 0.05, ∗∗p ≤ 0.01, ∗∗∗p ≤ 0.001). NS, not significant. All data are representative of at least three independent experiments.