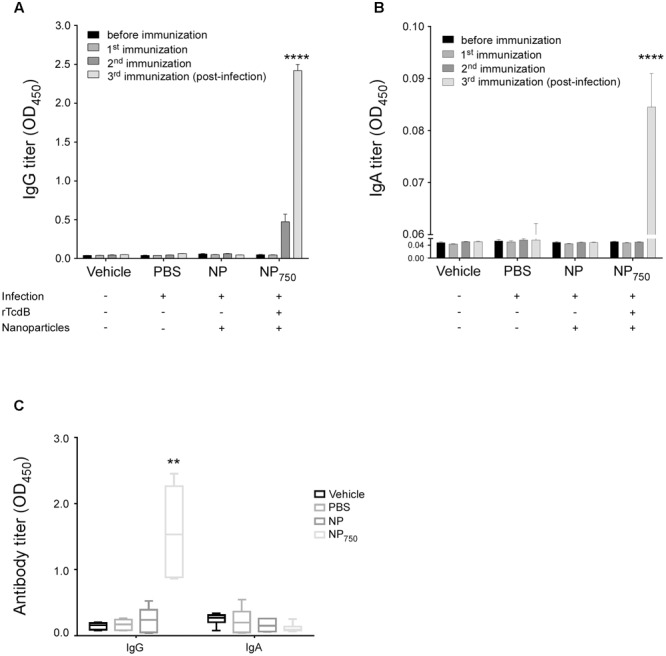
FIGURE 7.

Presence of antigen-specific IgG and IgA in NP-rTcdB vaccinated mice after C. difficile challenge. rTcdB-specific IgG (1:20,000 dilution) (A) and IgA (1: 1,000 dilution) (B) from serum of different treatment groups were compared by ELISA. (C) rTcdB-specific IgG and IgA from gastrointestinal lavage (GAL) (1:2 dilution) were also compared. All data are presented as mean ± standard deviations. Statistical comparisons between NP-rTcdB vaccinated and empty nanoparticle vaccinated group were analyzed by Student’s t-test (∗∗P ≤ 0.01, ∗∗∗p ≤ 0.001, ∗∗∗∗p ≤ 0.0001). All data are representative of at least three independent experiments.
