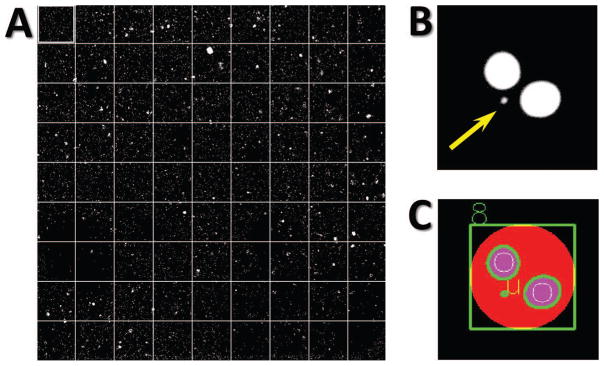
FIG. 4.
Imaging and image analysis. Panel A: A set of 81 images captured by IN CELL Analyzer using 20× objective lens representing one well of 96-well imaging plate with fixed and DAPI-stained sample. Panel B: Cropped image from a well of 96-well imaging plate with a cell with 2 nuclei and micronucleus (yellow arrow) and panel C: the same cell (green circle) with 2 nuclei (magenta circles with green border) and micronucleus (green dot), as delineated by FluorQuantMN.

