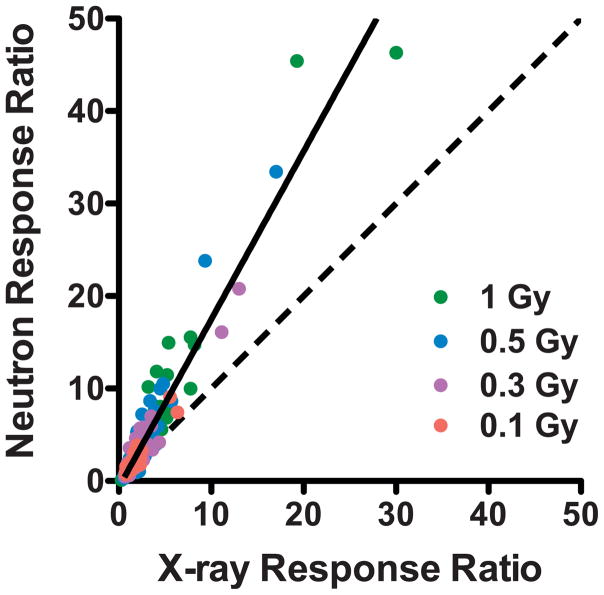
FIG. 1.
Comparison of the fold-change in gene expression relative to controls after irradiation of blood to equal doses of X rays and neutrons. Points are plotted individually for each dose (pink, 0.1 Gy; purple, 0.3 Gy; blue, 0.5 Gy; green, 1 Gy) for each of the 125 genes that were significantly differentially expressed after both photon and neutron exposure. The dashed line indicates an identical response to both qualities of radiation (RBE = 1) and the solid line is a linear fit to all data points (slope = 1.8).

