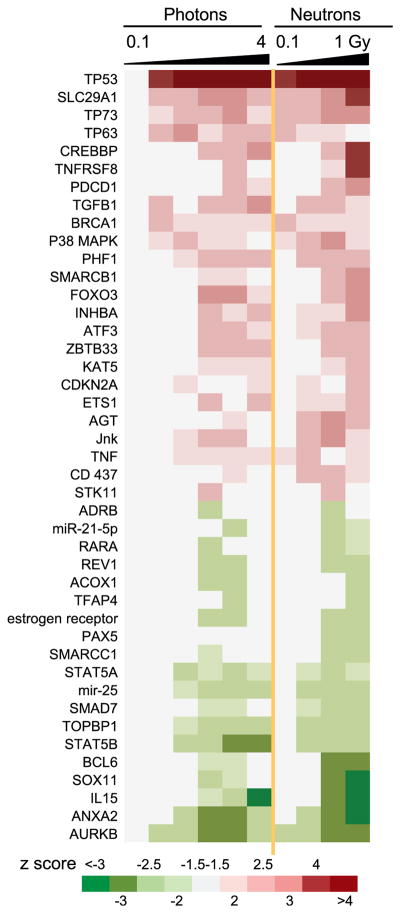
FIG. 3.
Potential upstream regulators of differentially expressed genes by dose predicted using Ingenuity Upstream Regulator Analysis in IPA. Potential regulators significant (|z|>2) at two or more doses are shown. The columns represent, from left to right, doses of 0.1, 0.3, 0.5, 1, 2 and 4 Gy of X rays, and 0.1, 0.3, 0.5 and 1 Gy neutrons. The colors represent positive (red, indicating activation of regulator) and negative (green, indicating suppression of regulator activity) z scores as indicated in the color key. Note that z scores with absolute value between 1.5 and 2 have also been colored to illustrate potential activity trends.

