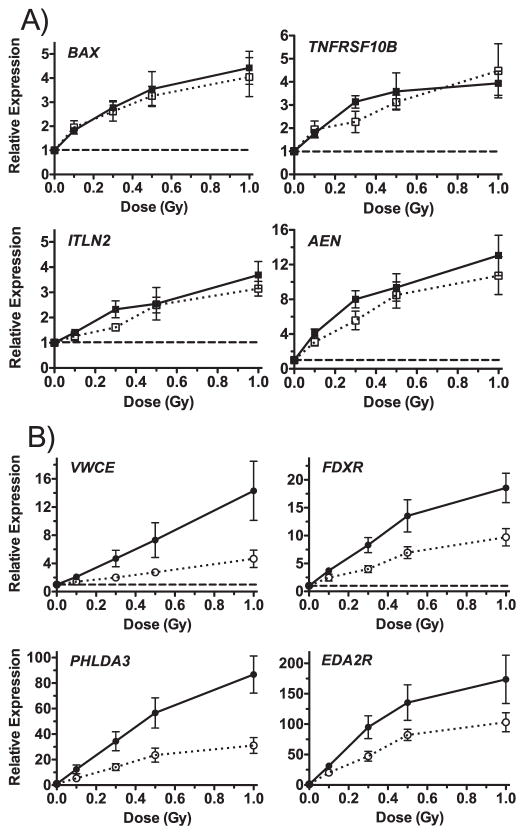
FIG. 4.
Real-time quantitative RT-PCR of genes showing different RBE relationships by microarray analysis. Panel A: BAX, TNFRSF10B, ITLN2 and AEN had an RBE close to 1 across the dose range tested for neutron exposure (solid symbols and lines) compared to X-ray exposure (open symbols and dotted lines). Panel B: VWCE, FDXR, PHLDA3 and EDA2R showed a greater effect after neutron exposure (solid symbols and lines) in comparison to X-ray exposure (open symbols and dotted lines). Points are the mean of measurements in 5 different donors (4 for ITLN2) and error bars are SEM. The dashed lines indicate the level in sham controls.

