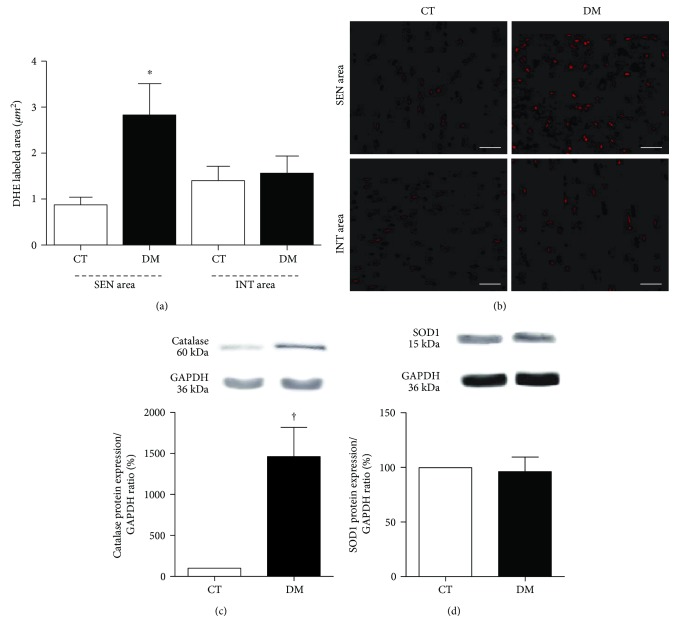
Figure 2.
(a) Quantitative analysis of microfluorotopography of DHE oxidation products performed 8 weeks after diabetes induction. ∗p < 0.01 versus the CT SEN area. Data expressed in mean ± SEM. (b) Representative photomicrograph of SEN and INT areas, showing microfluorotopography of DHE oxidation products. Red staining indicates the fluorescence signal by DHE under 400x magnification. Bars: 50 μm. Western blot protein expression analysis depicting antioxidant enzymes catalase (c) and SOD1 (d) performed 8 weeks after diabetes induction. †p < 0.001 versus the CT group. Data expressed in mean ± SEM.

