Figure 2.
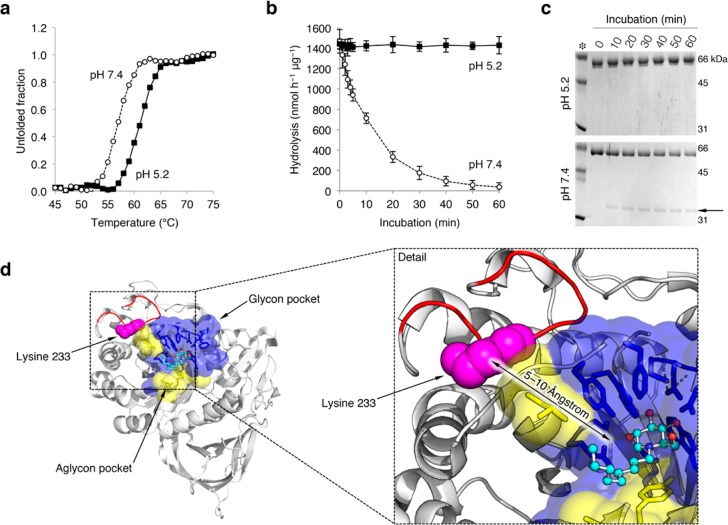
pH affects the structure of rGBA. (a) rGBA melting curve at pH 5.2 (closed squares) and pH 7.4 (open circles) as determined by circular dichroism. (b) Time-dependent decay of rGBA activity at pH 5.2 (closed squares) and pH 7.4 (open circles), as determined by hydrolysis of 4MU-β-d-Glc substrate at pH 5.2. Data are averages of duplicate values ± SD (c) Coomassie brilliant blue staining of the time-dependent tryptic digestion of rGBA with a trypsin/rGBA ratio of 1/10 (w/w) at pH 5.2 and 7.4 (top and bottom, respectively). The 35 kDa tryptic fragment is highlighted by an arrow. (d) Trypsin cleavage site at lysine 233 (pink spheres) present on the flexible outer loop (red) shown on the crystal structure of GBA in complex with NN-DNJ (PDB code: 2V3E), with NN-DNJ shown using a ball and stick model. Amino acid residues of the glycon binding pocket of GBA are shown in blue, and residues of the aglycon site are shown in yellow. A detail view of the rendered structure is shown to the right.

