Figure 3.
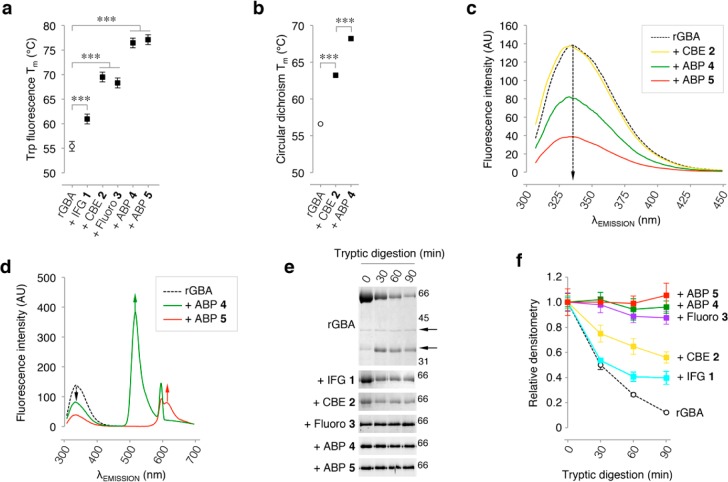
rGBA conformational changes monitored by intrinsic fluorescence and tryptic digestion. (a) Melting temperature (Tm) determined by tryptophan fluorescence of rGBA in the absence (control) or presence of saturating concentrations of inhibitors IFG 1, CBE 2, fluoro 3, or β-epoxide ABPs 4 and 5. Statistical analysis of n = 3 experiments, two-way ANOVA (***, p < 0.001). (b) Tm determined by circular dichroism of rGBA in the absence or presence of saturating concentrations of inhibitors 2 and 4. Statistical analysis of n = 2, two-way ANOVA (***, p < 0.001). (c) rGBA fluorescence spectra at λEX 295 nm in the absence of additives (black dashed line) with a maximum λEM of 335 nm, in complex with CBE 2 (yellow) with a maximum λEM of 333 nm, with ABP 4 (green) with a maximum λEM of 332 nm, and with ABP 5 (red) with a maximum λEM of 331 nm. (d) rGBA fluorescence spectra showing fluorescence quenching by ABP 5 (red) with the appearance of an emission peak at 610 nm and ABP 4 (green) with the emergence of an emission peak at 515 nm. All measurements were done in 10 mM phosphate buffer, 150 mM NaCl, pH 7.4. (e) Time-resolved analysis of the tryptic digestion of rGBA in complex with IFG 1, CBE 2, fluoro 3, ABP 4, or ABP 5. (f) Quantification of rGBA band densitometry during tryptic digestion in the absence (black dashed line) and presence of ABP 5 (red), ABP 4 (green), fluoro 3 (magenta), CBE 2 (yellow), or IFG 1 (cyan). Duplicate quantifications ± SD.

