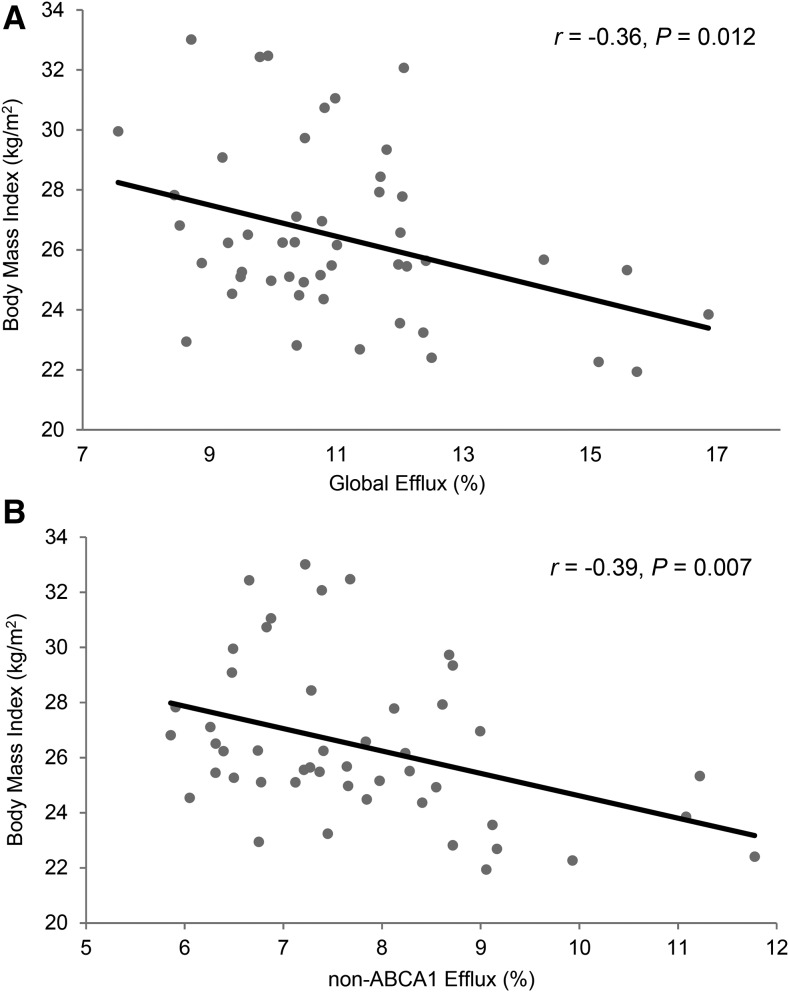
FIGURE 1.
Association between BMI and global cholesterol efflux (A) and non-ABCA1 cholesterol efflux (B) at baseline in adults with elevated serum LDL cholesterol. Each participant is denoted by a solid black circle. The linear regression trend line is denoted by the solid black line. ABCA1, ATP binding cassette transporter A1.

