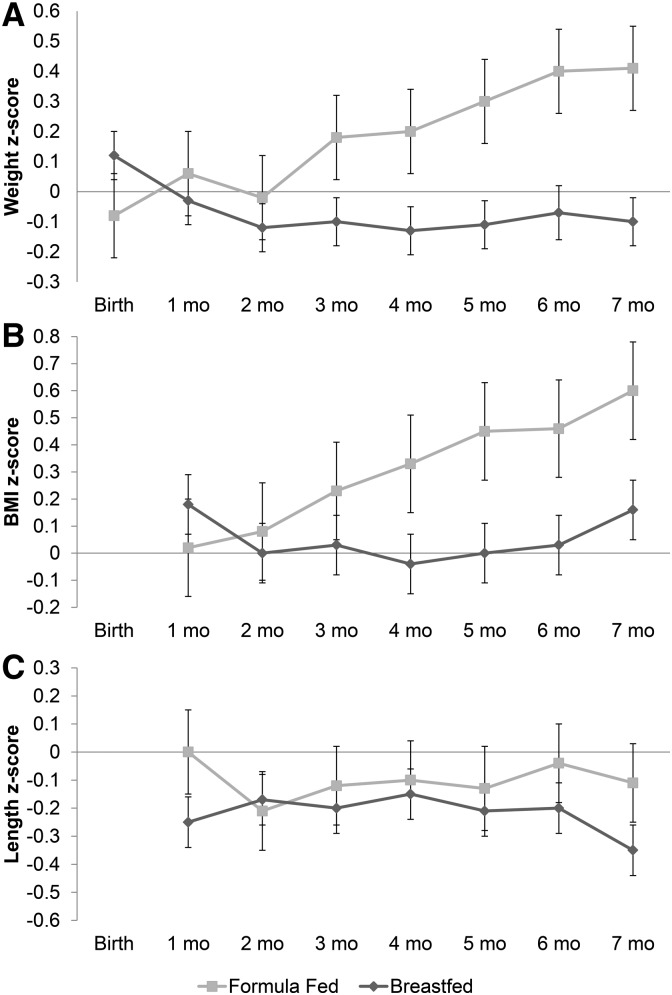
FIGURE 2.
Trajectories of z scores for infant weight (A), BMI (B), and length (C) in formula-fed and breastfed infants. Results are displayed as estimated mean z scores ± SEMs from repeated-measures ANOVA adjusted for sex, gestational age, race/ethnicity, maternal education level, insurance type (public or no insurance, private insurance), study site, and maternal BMI. Weight and BMI z scores of formula-fed infants increased progressively over time, whereas they remained consistent in breastfed infants. These trajectories in weight and BMI z scores were statistically different between feeding groups (P < 0.001 and P = 0.02, respectively) whereas length z score trajectories were not (P = 0.16).

