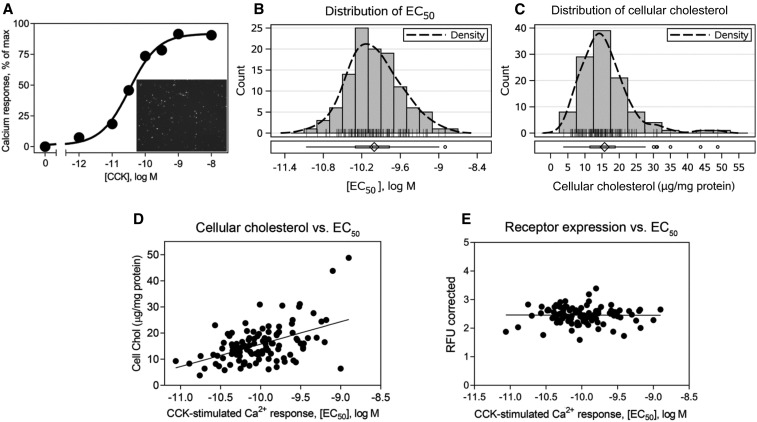
FIGURE 1.
Distribution of CCK sensitivity in the patient population and its correlation with cellular cholesterol. Shown is a typical CCK concentration-response curve generated by measuring increase in intracellular calcium concentrations in leukocytes 24 h after transduction (A). The inset in panel A shows a representative image of the efficiency CCK1R expression achieved within this time as measured by GFP fluorescence. Histograms of the CCK EC50 (B) and cellular cholesterol (C) distributions, with density curves for the total population included in the study (n = 112). Correlation plots between the CCK EC50 on the x axis and cellular cholesterol (r = 0.4051, P = 0.000009) (D) or CCK1R expression level as measured by GFP fluorescence (r = −0.005468, P = 0.9569) (E) on the y axis. Spearman’s correlation test was used to obtain the r and P values. CCK, cholecystokinin; CCK1R, type 1 cholecystokinin receptor; Chol, cholesterol; EC50, concentration stimulating one-half of the maximal response; GFP, green fluorescent protein; max, maximum; RFU, relative fluorescence unit.

