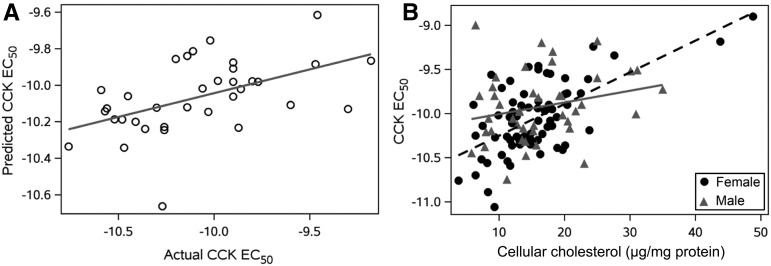
FIGURE 3.
Multivariate models to predict CCK EC50 values in patient populations. (A) Actual and predicted CCK sensitivity (EC50 values) among diabetic participants based on a model that included HDL cholesterol and glycated hemoglobin as predictor variables (line represents the unity line where the actual CCK EC50 equals the predicted CCK EC50; n = 35; r2 = 0.26, P < 0.01). (B) Actual CCK sensitivity data by leukocyte cellular cholesterol values with plotting symbols for men (n = 43) and women (n = 69) in the entire population (lines represent predicted CCK EC50 based on a model that included sex, leukocyte cellular cholesterol, and sex-by-leukocyte cellular cholesterol interaction). The overall r2 value for the model was 0.29 (P < 0.001). Sex subgroupings without a cell cholesterol-by-sex interaction term included estimates of r2 = 0.40 (P < 0.001) for women and r2 = 0.06 (P = 0.12) for men. CCK, cholecystokinin; EC50, concentration stimulating one-half of the maximal response.

