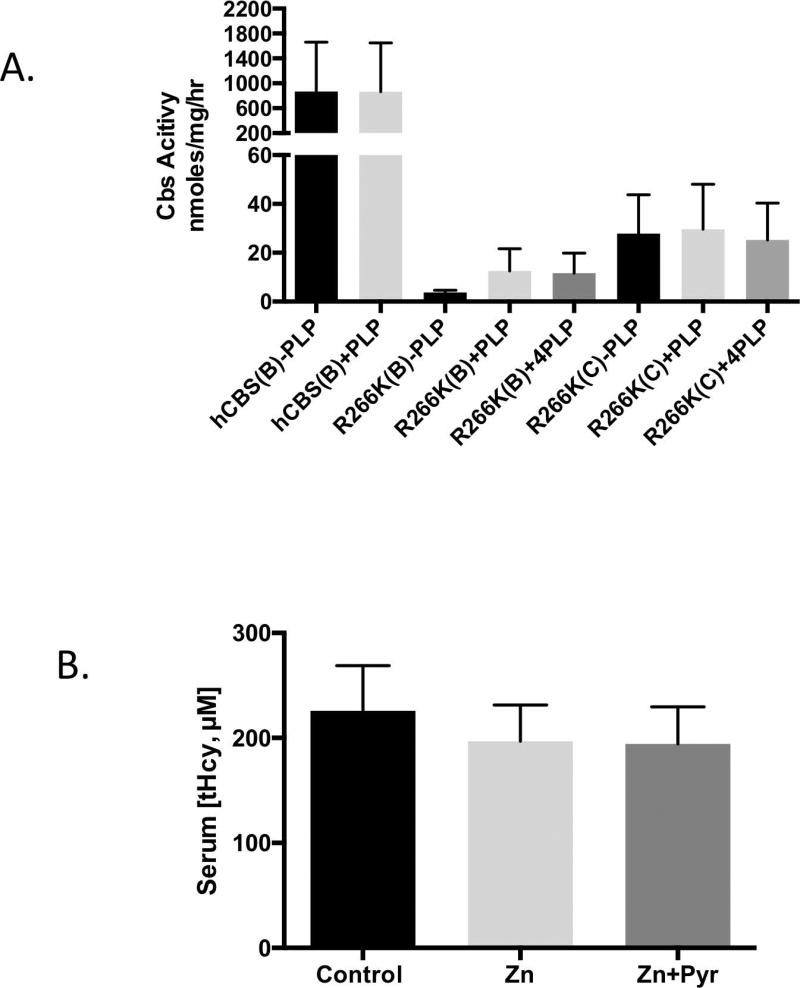
Figure 3. Response to pyridoxine.
A: Dialyzed liver extracts from Zn-treated mice carrying the indicated transgene in the indicated strain (B=C57BL/6J; C=C3H/HeJ). Each reaction was done either in the absence (-PLP), or presence of 50 µM (+PLP) or 200 µM (+4PLP) PLP. Error bars show SD (n=3 or 4). B: Comparison of tHcy in Tg-R266K Cbs−/− mice (C3H/HeJ,) treated with either regular water, zinc-water (25 mM), or zinc-water plus pyridoxine (400 mg/L). Error bars show SD (n=8 per group)

