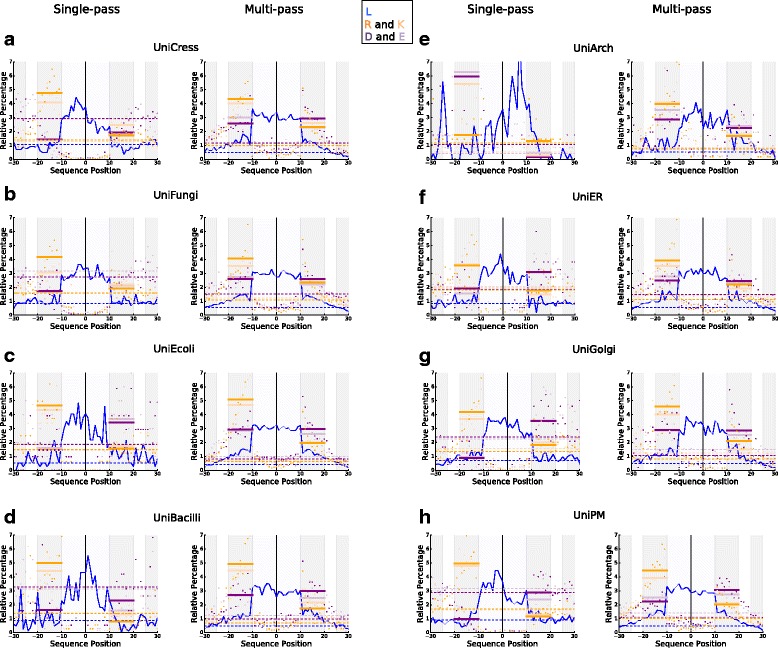
Fig. 6.

Comparing charged amino acid distributions in TMHs of multi-pass and single-pass proteins across different species and organelles. The relative percentage distribution of charged residues and leucine was calculated at each position in the TMH with flank lengths of ±20 in different datasets. The distributions are normalised according to relative percentage distribution. Aspartic acid and glutamic acid are shown in dark purple and light purple respectively. Leucine, the most abundant non-polar residue in TMHs, is in blue. Arginine and lysine are shown in orange. TMHs from single-pass proteins are on the left and TMHs from multi-pass proteins are on the right for different taxonomic datasets: a UniCress, b UniFungi, c UniEcoli, d UniBacilli, e UniArch, and different organelles: f UniER, g UniGolgi, h UniPM. As a trend, the negative-outside skew is more present in TMHs from single-pass proteins than multi-pass proteins (Tables 2 and 3). Another key observation is that in single-pass TMHs there is a propensity for leucine on the inner over the outer leaflet (Table 4)
